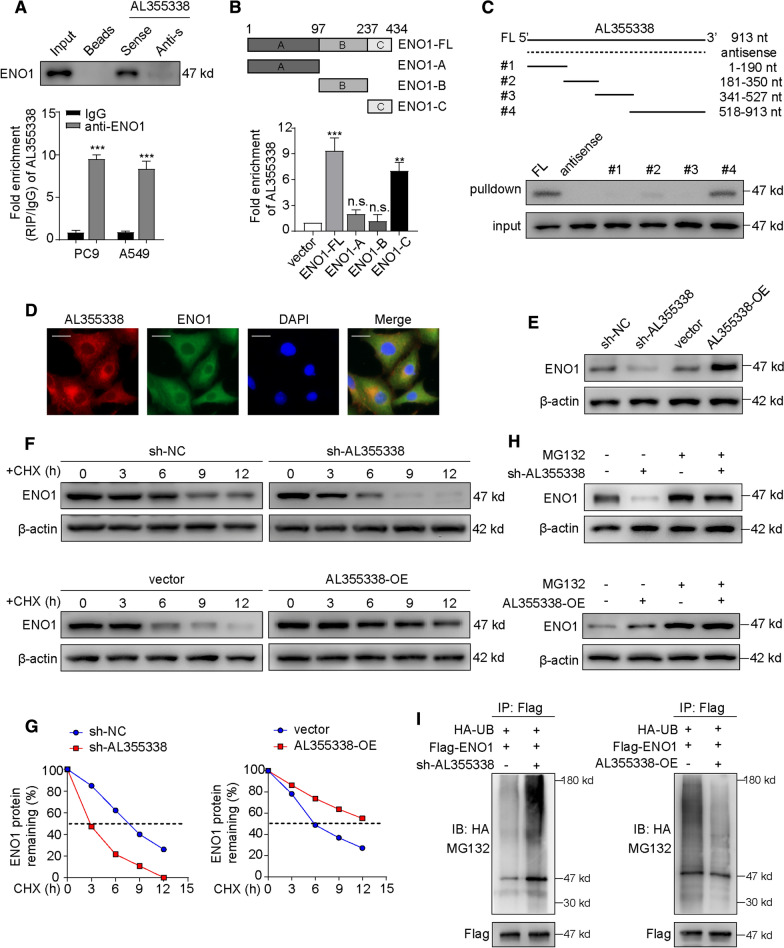
Fig. 5.
AL355338 specifically interacted with ENO1 and enhanced the stability of ENO1 protein. A Proteins retrieved from the AL355338 pull-down assay were analyzed by western blot analysis (in the upper panel). RIP assays using anti-ENO1 antibody showed that ENO1 interacted with AL355338 in A549 and PC9 cells (in the bottom panel). B RIP assay was performed in 293T cells transfected with flag-tagged ENO1 vector or its deletion mutants (4/TO-flag vector as negative control). QRT-PCR was used to measure the enrichment of AL355338. C Western blot detection of the ENO1 protein in A549 cells as retrieved by in vitro transcribed biotinylated RNAs of different constructs of AL355338 and its antisense sequence serve as negative control. D Representative images of co-staining AL355338 (red) and ENO1 (green) in A549 cells by combination of FISH and immunofluorescence. Scale bar, 10 μm. E Western blot showed that ENO1 protein level was positively regulated by AL355338 in A549 and PC9 cells. F A549 cells transfecting with si-NC or si-AL355338 and PC9 cells transfecting with pcDNA-vector or pcDNA-AL355338 were treated with cycloheximide (CHX, 100 μg/ml) for the indicated periods of time. Cell lysates were analyzed by western blot to examine ENO1 protein half-life. G Half-life of ENO1 from CHX-treated protein band intensity was analyzed by ImageJ. H A549 cell expressing either si-NC or si-AL355338 and PC9 cell expressing either vector or AL355338-OE were treated with or without MG132 (50 μM) for 6 h. Cell lysates were analyzed by western blot with indicated antibodies. I In vitro ubiquitination assay of cells transfected with si-AL355338 in A549 cell (left) or pcDNA-AL355338 in PC9 cell (right). All cells were co-transfected with flag-ENO1 and HA-UB plasmid, 42 h after transfection, cells were incubated with MG132 (50 μM) for 6 h. Cell lysates were immunoprecipitated with anti-flag antibody followed by immunoblotting analysis with anti-HA or anti-flag antibody. Data shown are mean ± SD (n = 3) (*P < 0.05, **P < 0.01, ***P < 0.001)

