
Fig. 1.
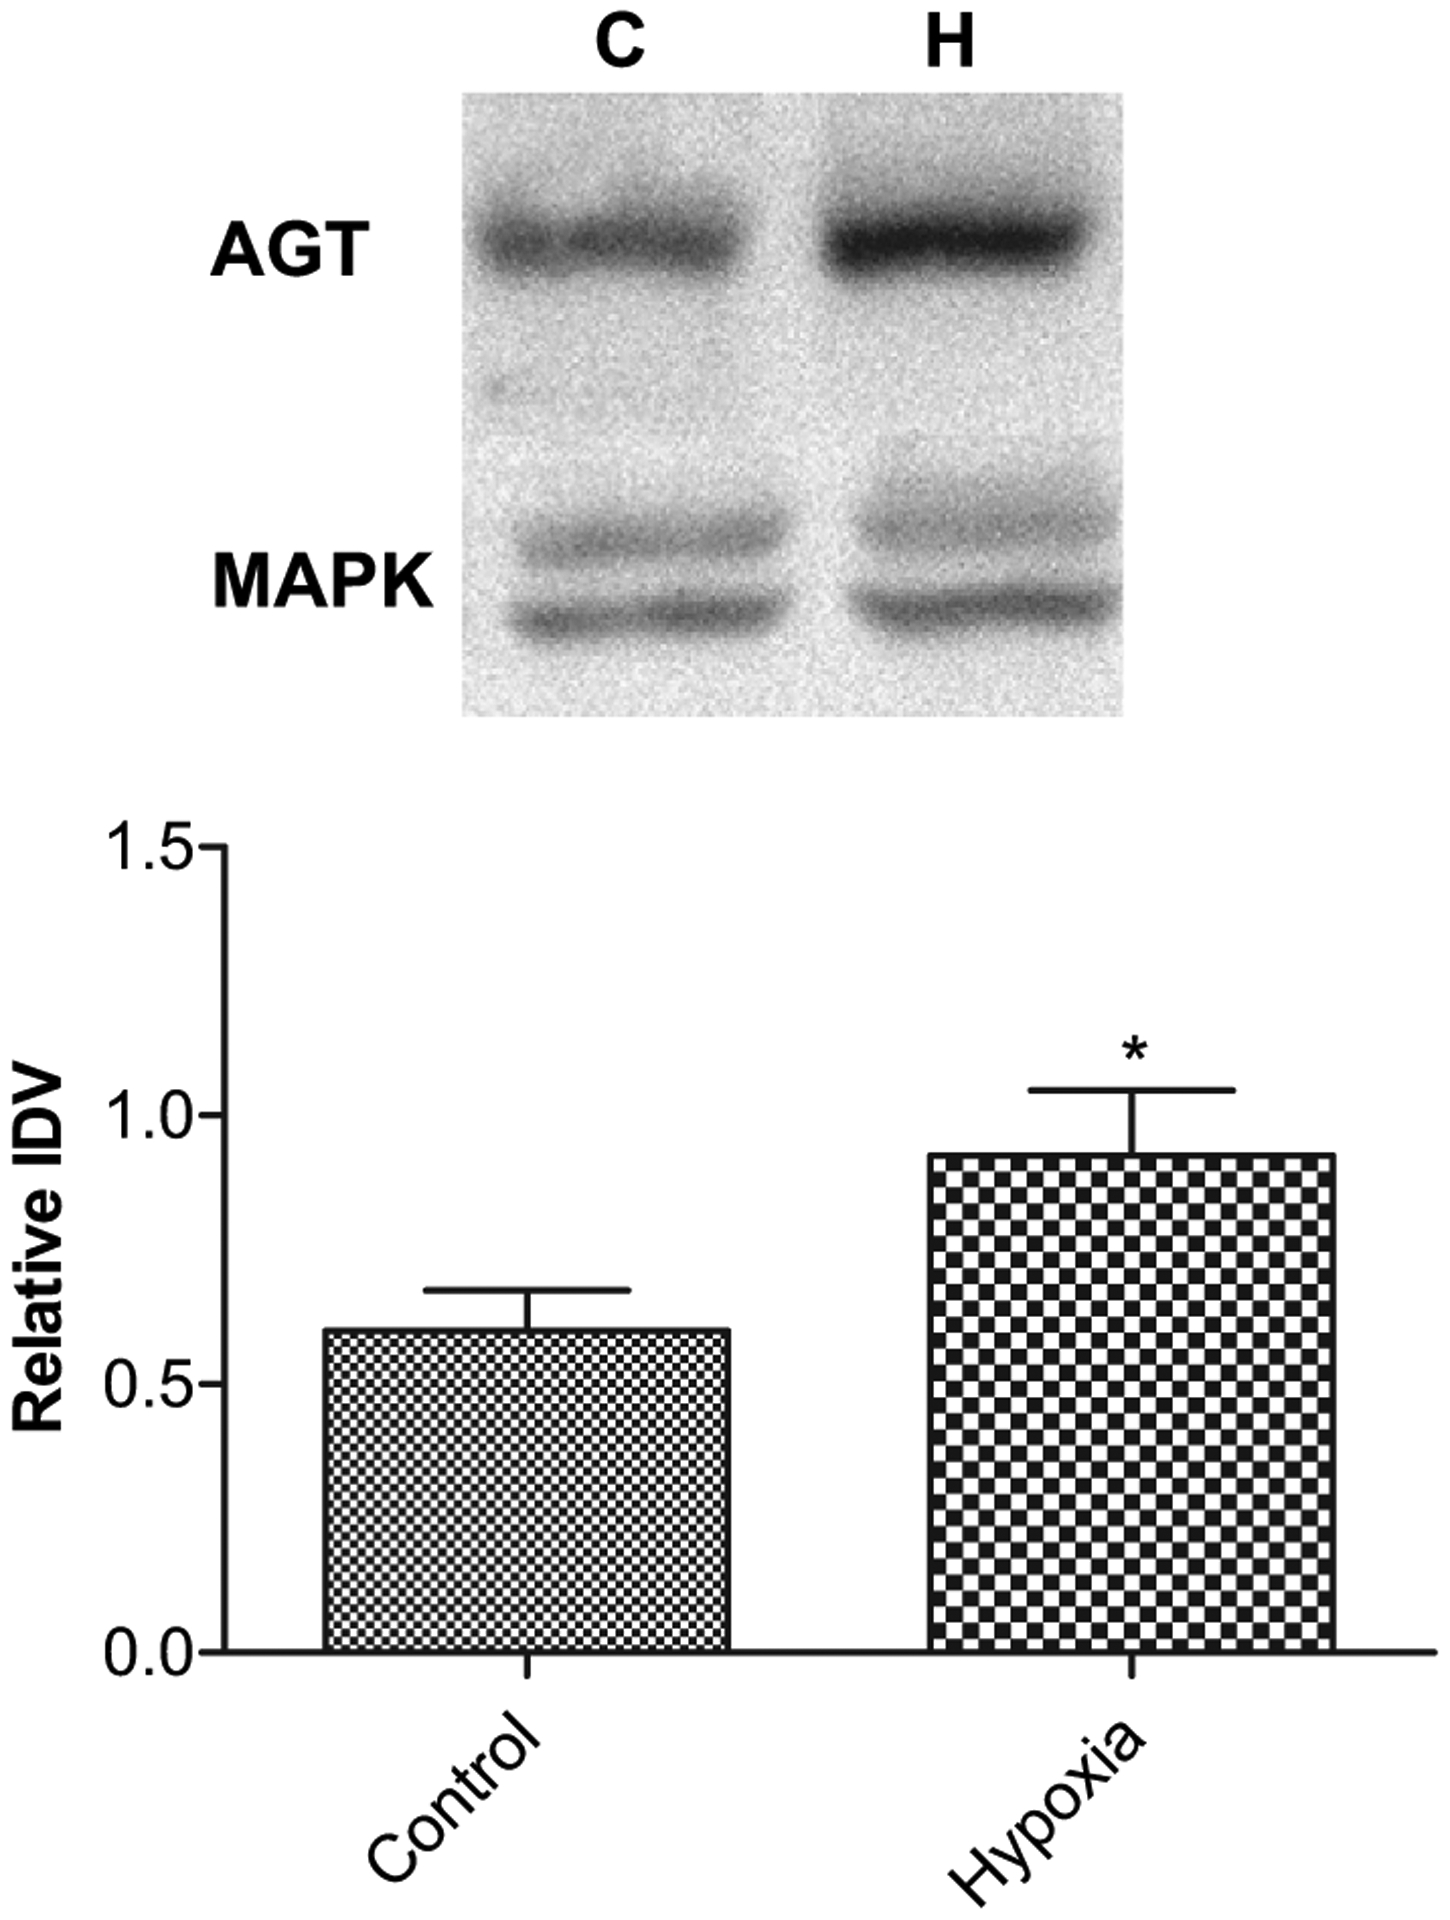
Acute antenatal hypoxia and angiotensinogen (AGT) protein expression in placenta. Top, representative Western immunoblot showing AGT expression with mitogen activated kinase (MAPK) as control. Bottom, bar graph demonstrating normalized relative integrated density value (IDV) of AGT protein expression in control and hypoxic placentae. *Denotes significant difference by an unpaired Student’s t-test (P < 0.05; n = 5).