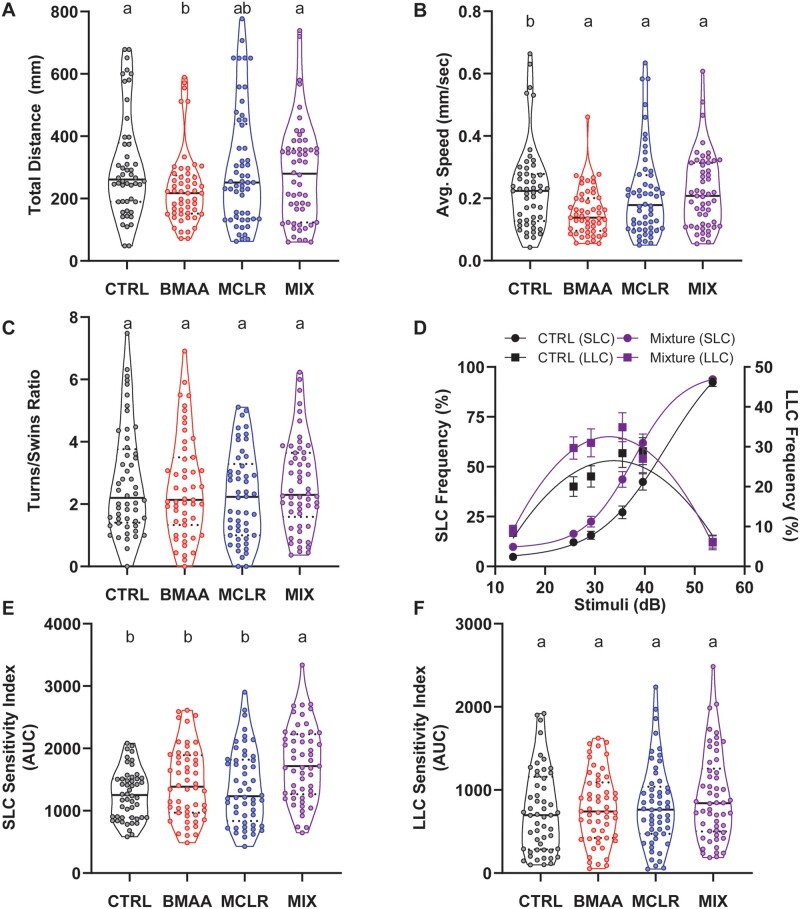
Figure 4.
BMAA and MCLR interact to enhance startle sensitivity. A, Violin plots depict the distribution of the total distance travelled during the 18.5-min spontaneous movement assay for each larva. B Violin plot of average speed. (C) Ratio of turns to swims. (D) Startle frequency curves for SLCs (left axis) and LLCs (right axis) in control larvae (0 µM of cyanotoxin, black) and mixture-treated larvae (100 µM BMAA plus 1 µM MCLR, purple). n = 54 siblings; mean ± SEM. E and F, SLC and LLC indices for each larva. Levels not connected by the same letter are significantly different–Tukey-Kramer HSD, alpha 0.05.

