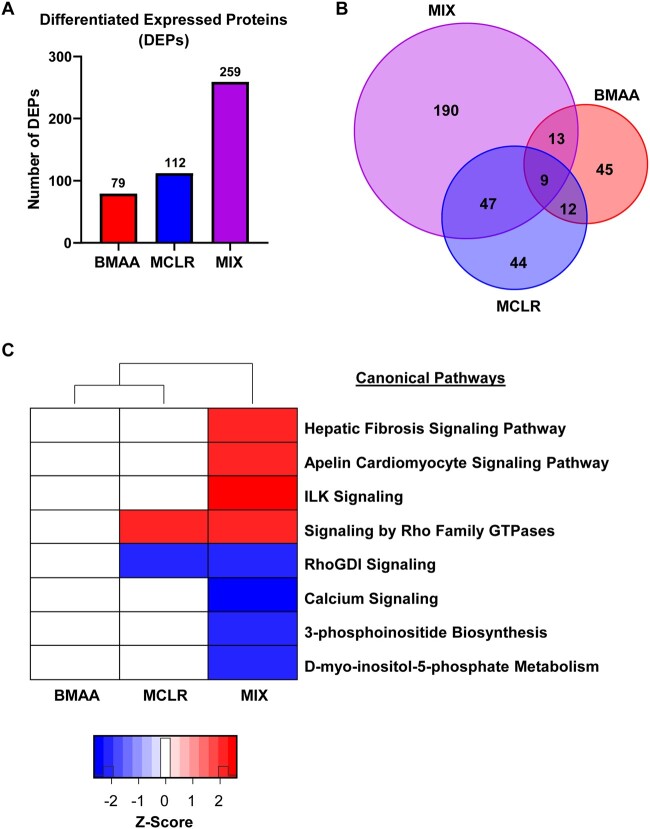
Figure 5.
BMAA/MCLR mixture increases protein dysregulation in vivo. A, Number of differentially expressed proteins (DEPs) per treatment condition. B Venn diagram showing overlap in DEPs between all treatment groups (red: BMAA protein group, the blue: MCLR protein group, purple: BMAA plus MCLR mixture protein group). C Heat map displaying the impacted canonical pathways from IPA functional analysis. The red or blue-colored rectangles in each column indicates the z-score activities. Red shading indicates predicted activation and blue shading indicates predicted inhibition according to the scale at right. This heat map represents the z-scores obtained from the comparison between significantly expressed proteins (p ≤ .05).

