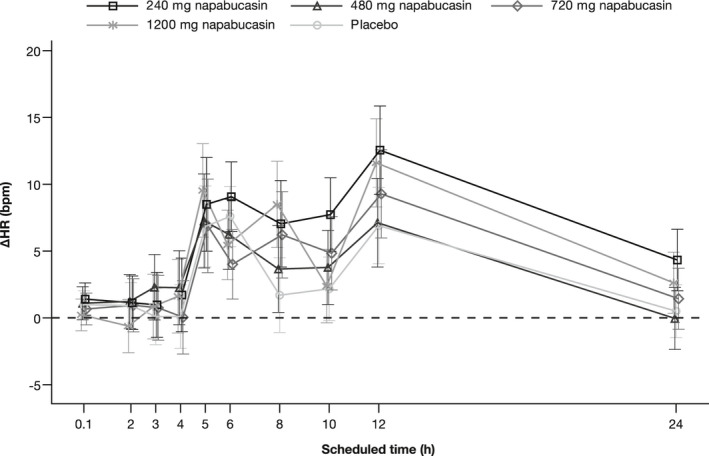
FIGURE 2.

Change from baseline in HR over time (QT/QTc analysis set)a,b. aThe 0.1 time point correlates with the pre‐dose time point. bData points represent LSMean with SE error bars. ∆, change from baseline; HR, heart rate; LSMean, least square means; QTc, QT interval corrected for heart rate; SE, standard error
