FIGURE 4.

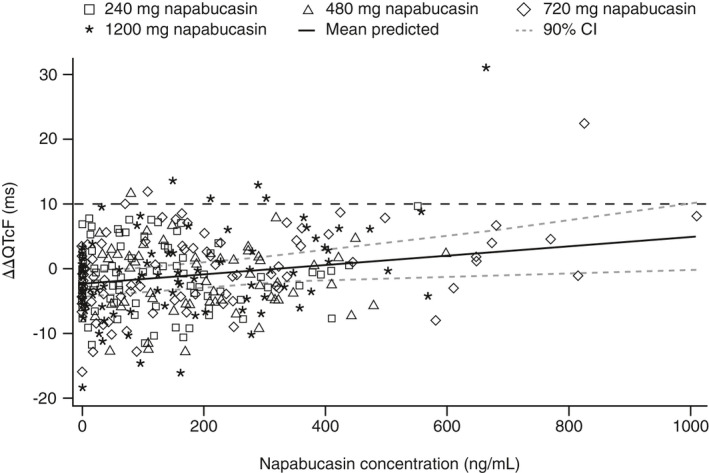
Scatterplot of observed napabucasin plasma concentrations and ΔΔQTcF by healthy participants (PK/QTc analysis set). CI, confidence interval; HR, heart rate; QTcF, QT interval corrected for HR using Fridericia's formula

Scatterplot of observed napabucasin plasma concentrations and ΔΔQTcF by healthy participants (PK/QTc analysis set). CI, confidence interval; HR, heart rate; QTcF, QT interval corrected for HR using Fridericia's formula