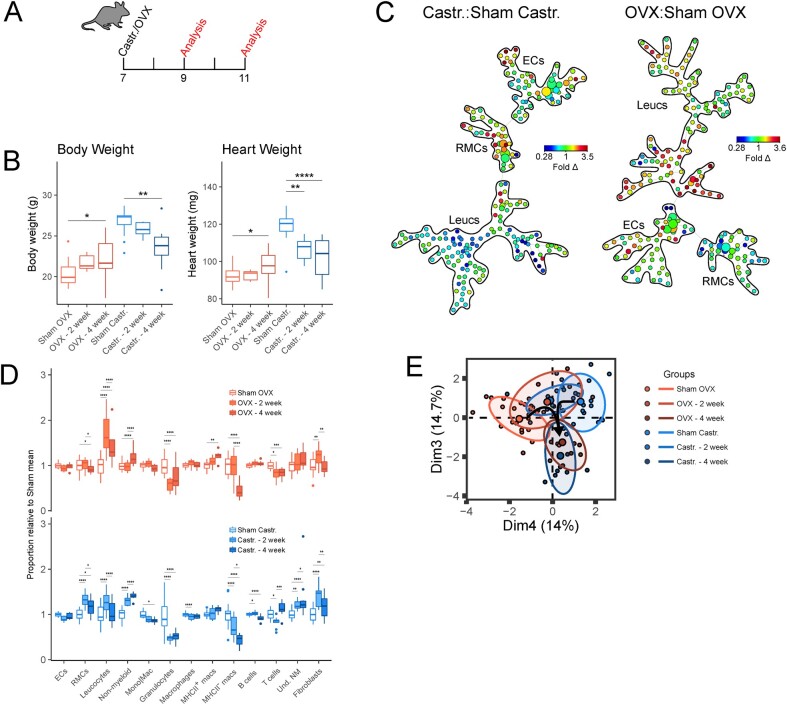
Figure 3.
Gonadal hormones maintain the homeostatic cardiac cellular signature in female and male hearts. (A) Experimental set-up for mouse ovariectomy (OVX) or castration (Castr.). (B) Body weight (left) and heart weight (right) measurements following sham surgery or gonadectomy. (C) Ratiometric (gonadectomy: sham surgery) SPADE analysis of broad cardiac cell types. Heatmap indicates fold difference (fold Δ) of cell populations in gonadectomized animals compared to sham controls. (D) Relative abundance of broad cell types (ECs, RMCs, and Leucs), broad leucocyte subsets (non-myeloid, Mono|Mac, granulocytes), macrophage subsets (MHCII+ macrophages and MHCII− macrophages), and non-myeloid subsets (B cells, T cells, and Und. NM cells) between gonadectomized animals and sham surgery controls. ECs (CD31+CD45−); RMCs (CD31−CD45−), leucocytes (Leucs; CD45+); monocytes/macrophages (Mono|Mac; CD45+CD11b+Ly6G−); granulocytes (CD45+CD11b+Ly6G+); macrophages (CD45+CD11b+Ly6G−CD64+); B cells (CD45+CD11b−MHCII+CD3ε−); T cells (CD45+CD11b−MHCII−CD3ε+); undetermined non-myeloid cells (Und. NM; CD45+CD11b−MHCII−CD3ε−). (E) Principal component analysis cellular composition of sham and gonadectomized mice. Principal components that best differentiated female and male non-gonadectomized cohorts were chosen. Parenthesis on axis labels indicate variation represented by principal component. See Supplementary material online, Figure S3, for all flow cytometry gating parameters and markers used for SPADE clustering. n = 13–15; all statistical analysis performed using Student’s t-test with statistical significance indicated as *(P ≤ 0.05), **(P ≤ 0.01), ***(P ≤ 0.001), and ****(P ≤ 0.0001). NS, P-value >0.05. Whiskers of box and whisker plots represent the highest and the lowest values, except when a value is beyond the range of 1.5 inter-quartile.

