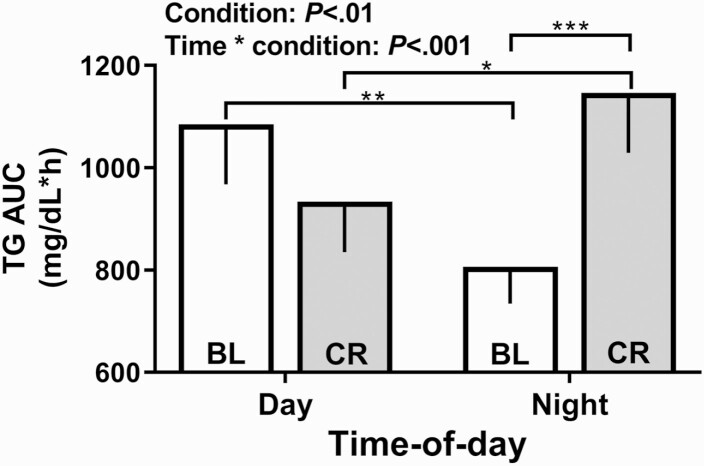
Figure 2.
Area under the curve by time-of-day under baseline and constant routine conditions for triglyceride. The area under the curve (AUC ± SEM) for triglyceride (TG) is shown for the day (left) and night (right) under baseline (BL) and CR conditions. Significant post hoc tests with a Holm-Sidak correction are denoted by the horizontal bars (*P < 0.05, **P < 0.01 and ***P < 0.001).

