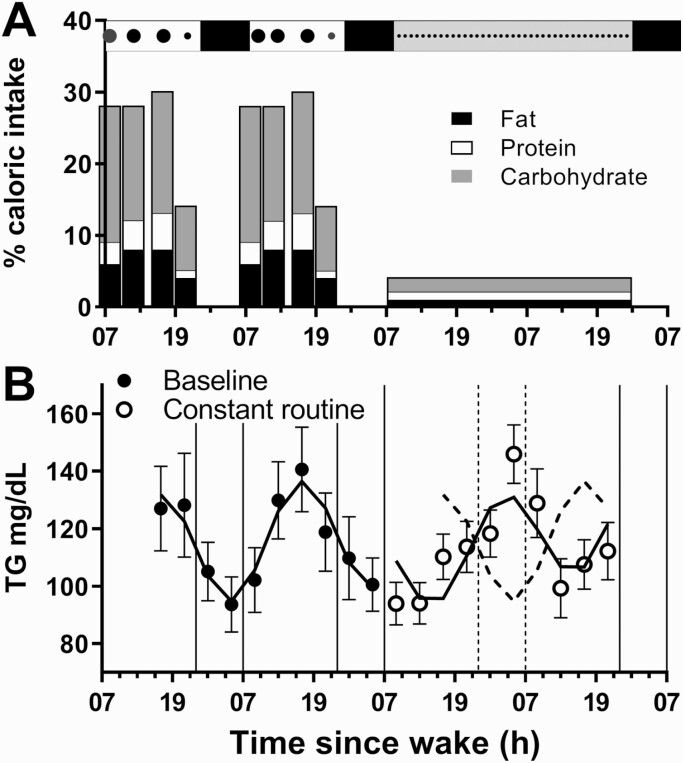
Figure 3.
Meal timing and 24-hour rhythms in triglyceride under baseline and constant routine conditions. The study protocol is represented at the top of panel A, where meal timing and relative sizes are indicated by the black circles. The percentage of daily caloric intake for each meal (breakfast, lunch, dinner and snack) is shown during baseline and for each CR snack, including the percentage of fat (black), protein (white) and carbohydrates (gray). The group-mean (± SEM) of unadjusted data and group-mean fitted cosinor regressions (—) for all participants under baseline (●) and CR (○) conditions are shown for TG (B). Baseline data are re-plotted (---) during the CR for comparative purposes.

