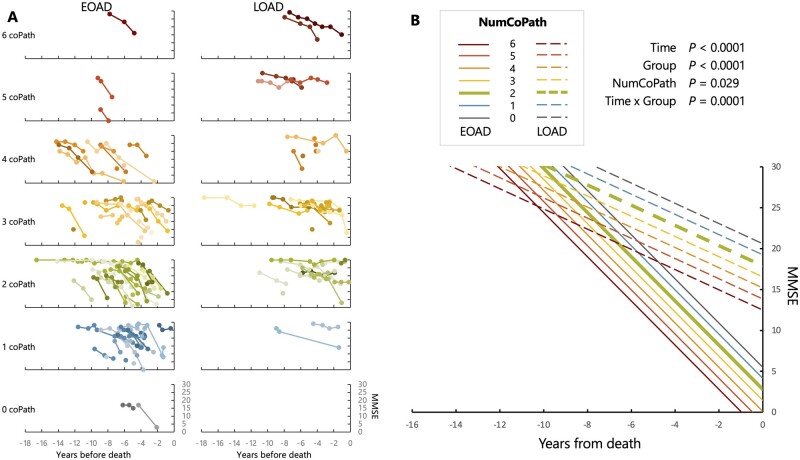
Figure 5.
Antemortem cognitive decline based on MMSE. (A) Raw individual trajectories in MMSE scores (raw values), stratified by age of onset group (columns) and number of co-pathologies (rows). Colour variations were randomly assigned to help distinguish overlapping lines. (B) Results of the optimal linear mixed effect model as identified in Supplementary Table 3. The predicted MMSE trajectories for EOAD and LOAD patients with two co-pathologies (the median number of co-pathologies in the whole cohort) are emphasized by a thicker line.

