
Figure 2.
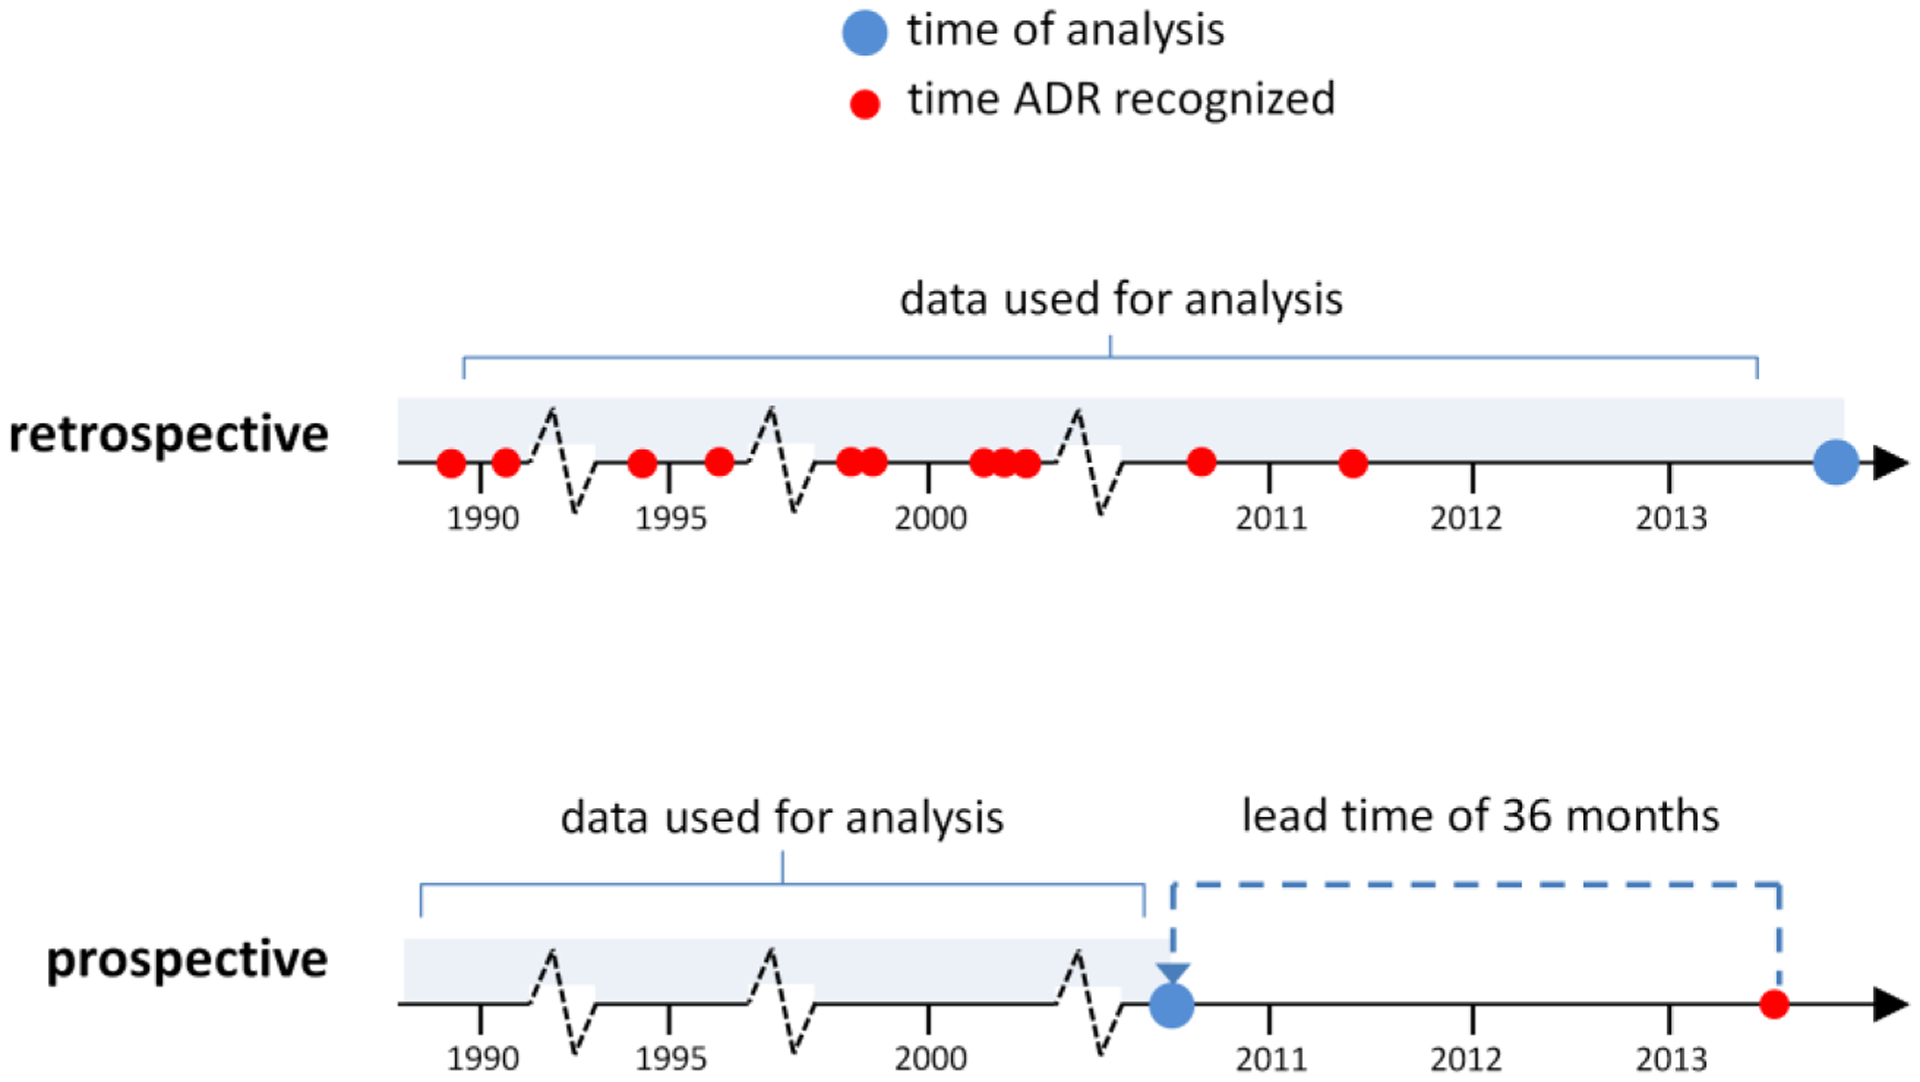
Retrospective versus prospective performance evaluation. In the retrospective evaluation all data up to the end of 2013 is used to generate signals for historical, known associations (and negative controls) from the OMOP benchmark. A prospective evaluation is simulated by backdating the analysis to a time period preceding the recognition of a given labeled ADR by an amount specified as lead time (e.g., 36 months). At this time point signal statistics for labeled ADRs and negative controls are generated from each data source.