
Figure 6.
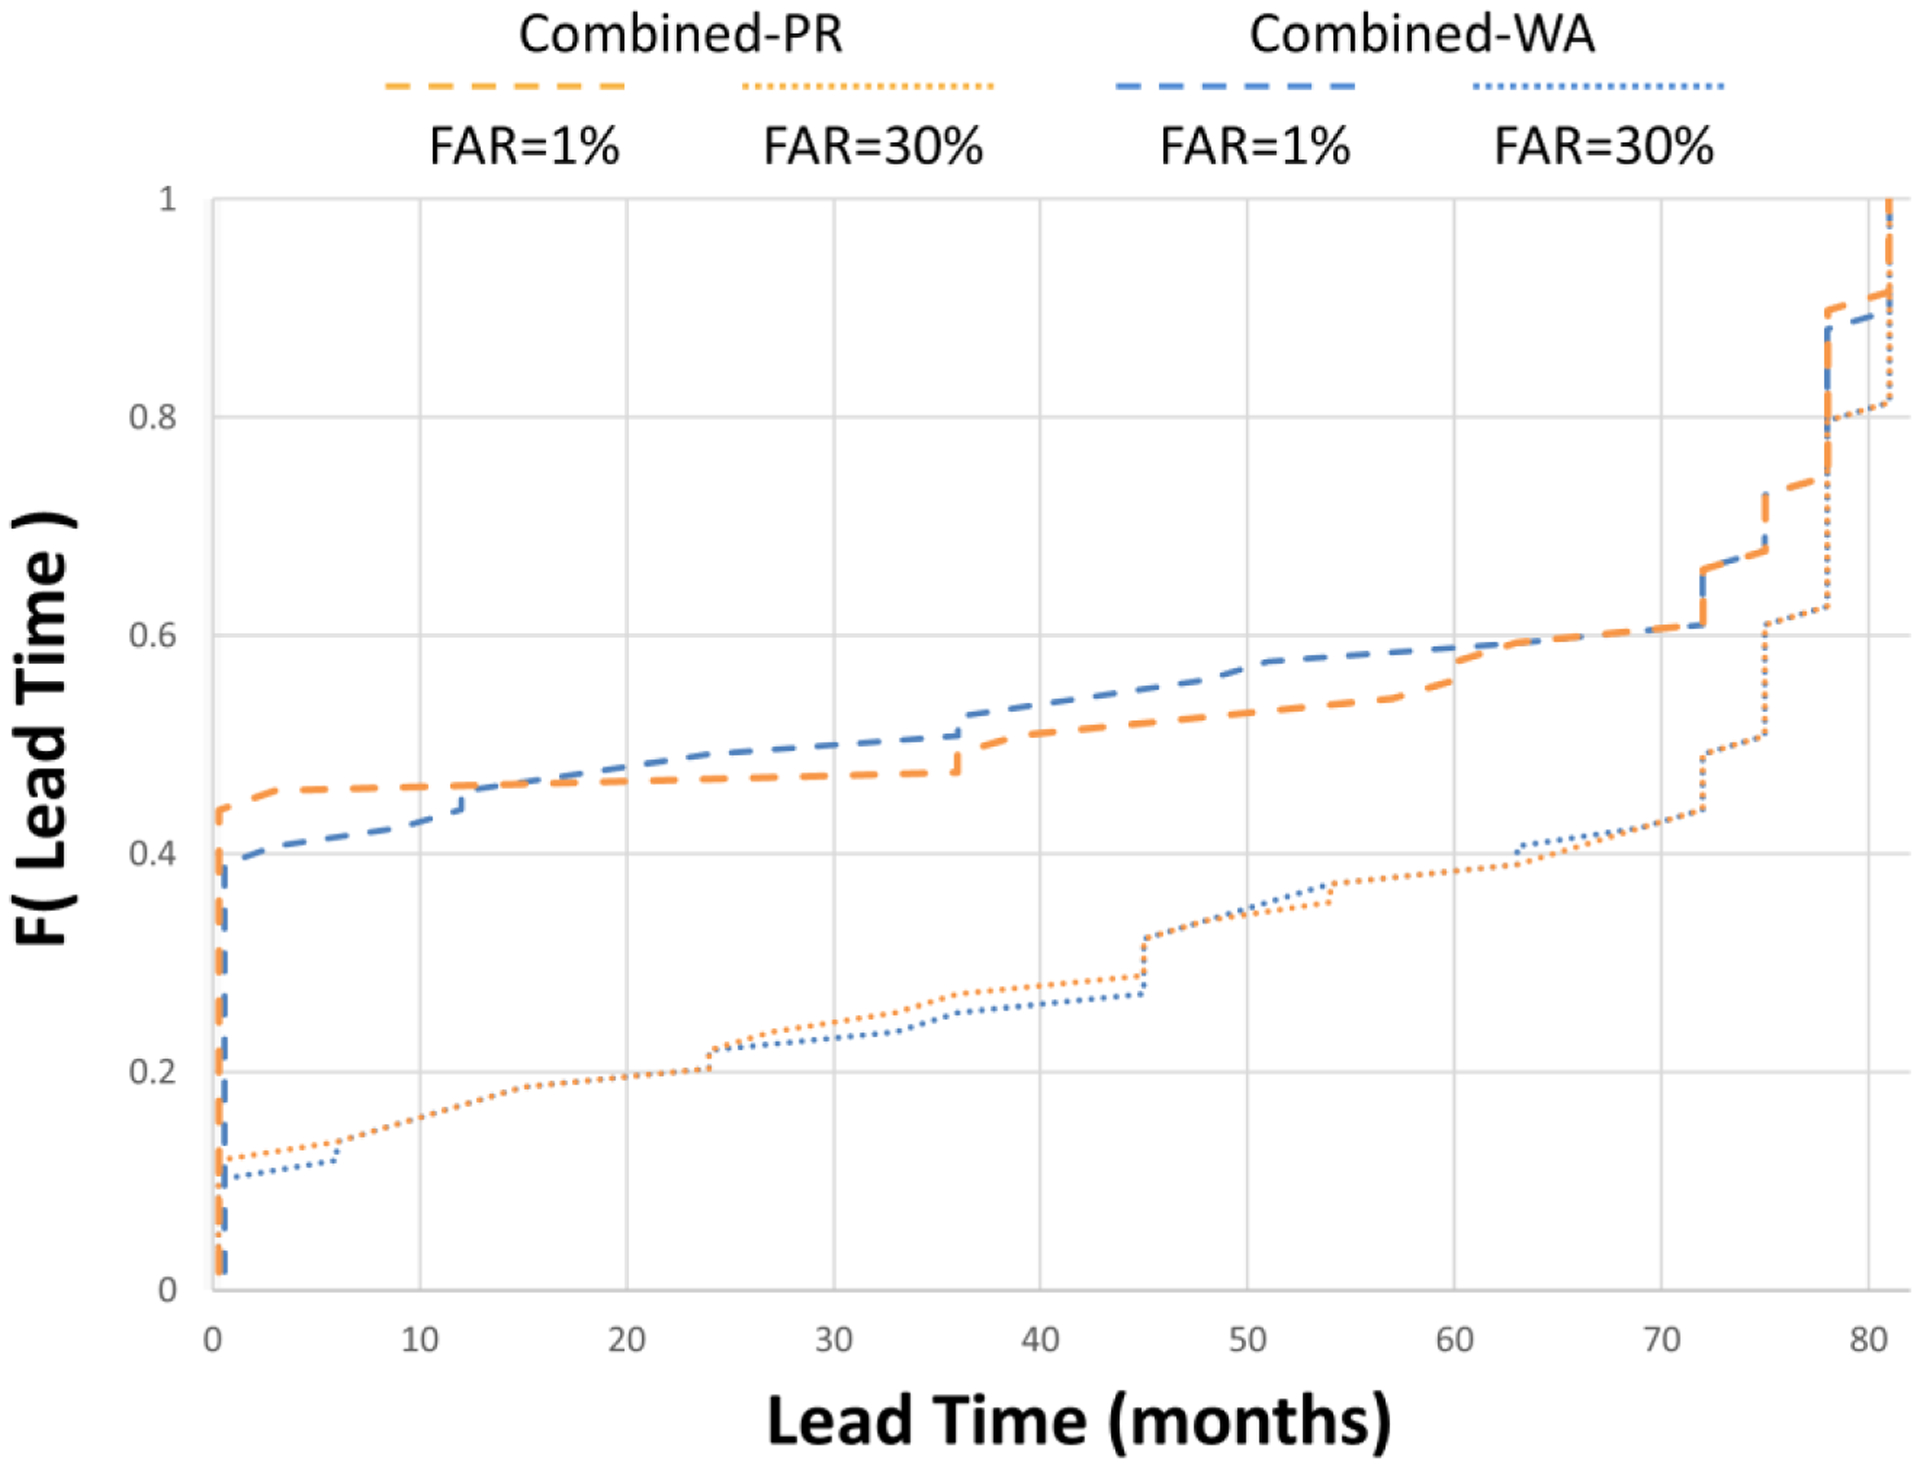
Cumulative distribution of lead times to detection for the class-leading methods to combine signals, given false alert rates of 1% and 30%. The lower the curve, the more probability mass attached to greater lead times. FAR; false alert rate. Combined-PR; combined signals produced by the best performing predictive algorithm. Combined-WA; combined signals produced by the best performing weighted averaging approach.