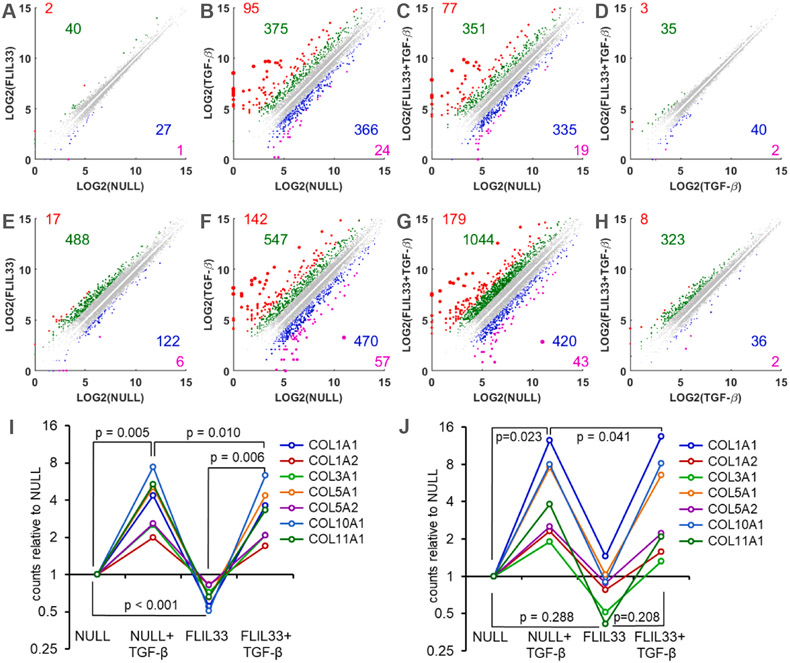
Fig. 4.
RNA-Seq transcriptomic profiling of NHLFs overexpressing FLIL33 vs transfected with a control non-coding vehicle plasmid (NULL). Additionally, 24 h later these cells were or were not activated with rhTGF-β, as indicated, for an additional 24 h (A–D, I) or 48 h (E–H, J). In panels A–H, log base 2 normalized counts are plotted for the indicated pair-wise comparisons at 24 h (A–D) and 48 h (E–H) of stimulation with rhTGF-β. The colorized dots represent genes with substantially different gene expression levels. The genes with 5-fold higher (red), 2- to 5-fold higher (green), 2- to 5-fold lower (blue), and 5-fold lower (magenta) expression levels are shown, with the similarly colored numbers representing the counts of the corresponding genes. In panels I and J (24 h and 48 h of stimulation with rhTGF-β, respectively), normalized counts for each of the indicated collagen genes are plotted relative to the corresponding count in NULL-transfected cells that were not stimulated with TGF-β. The lines connecting the data points designate the indicated collagen genes. The p-values were calculated using two-tailed paired t-test.

