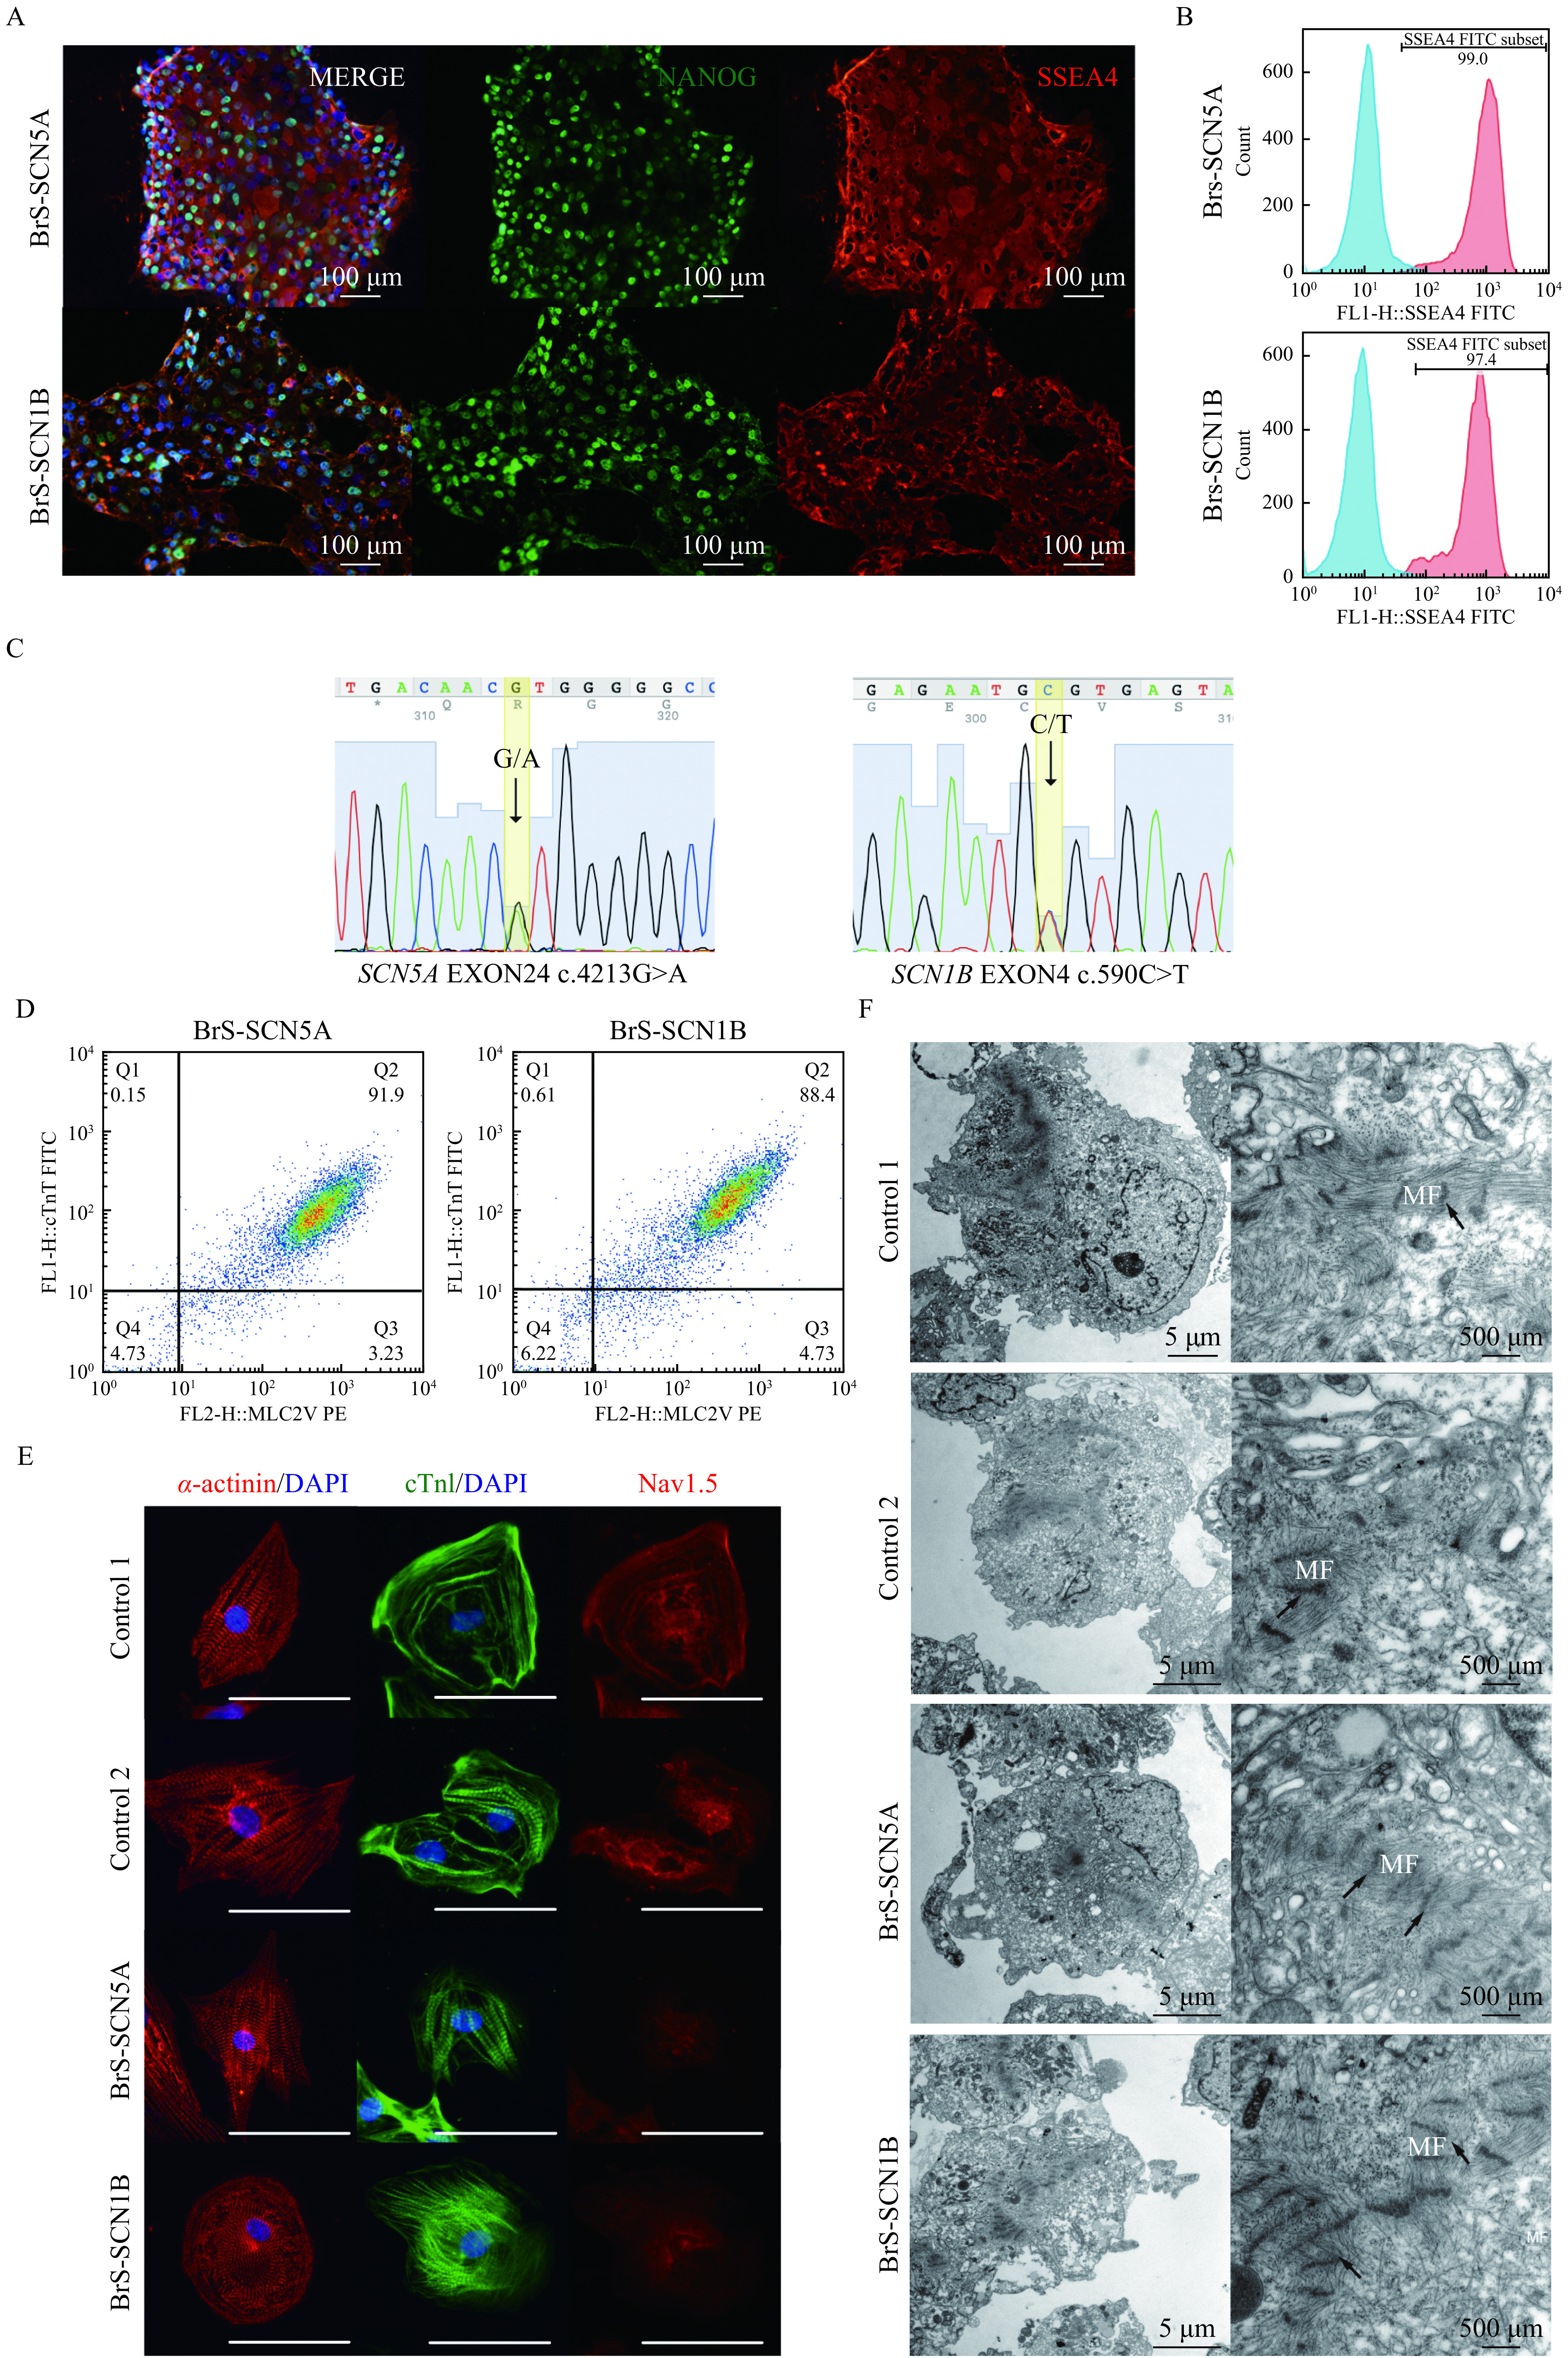
Figure 2.

Characterization of iPSC lines and differentiated cardiomyocytes.
A: Images of iPS cells stained with pluripotency markers NANOG (green), SSEA4 (red) for BrS-SCN5A and BrS-SCN1B iPS cell lines. Nuclei were stained with DAPI (blue). Scale bars, 100 μm. B: Flow cytometry analysis of pluripotency markers (SSEA4) in generated BrS iPSC lines. C: Genotyping of BrS-SCN5A and BrS-SCN1B iPSC lines focusing on the loci around each mutation confirmed by DNA sequencing. D: Representative flow cytometry confirming the high percentage of ventricular myocytes in differentiated cells. E: Immunostaining of sarcomeric α-actinin, cTnI, and Nav1.5 at 60 days post differentiation. Scale bars, 50 μm. F: TEM images of myofibrillar organization in control and BrS iPSC-CMs. Black arrow indicates z-lines. iPSC: induced pluripotent stem cell; TEM: transmission electron microscopy.
