
Figure 3.
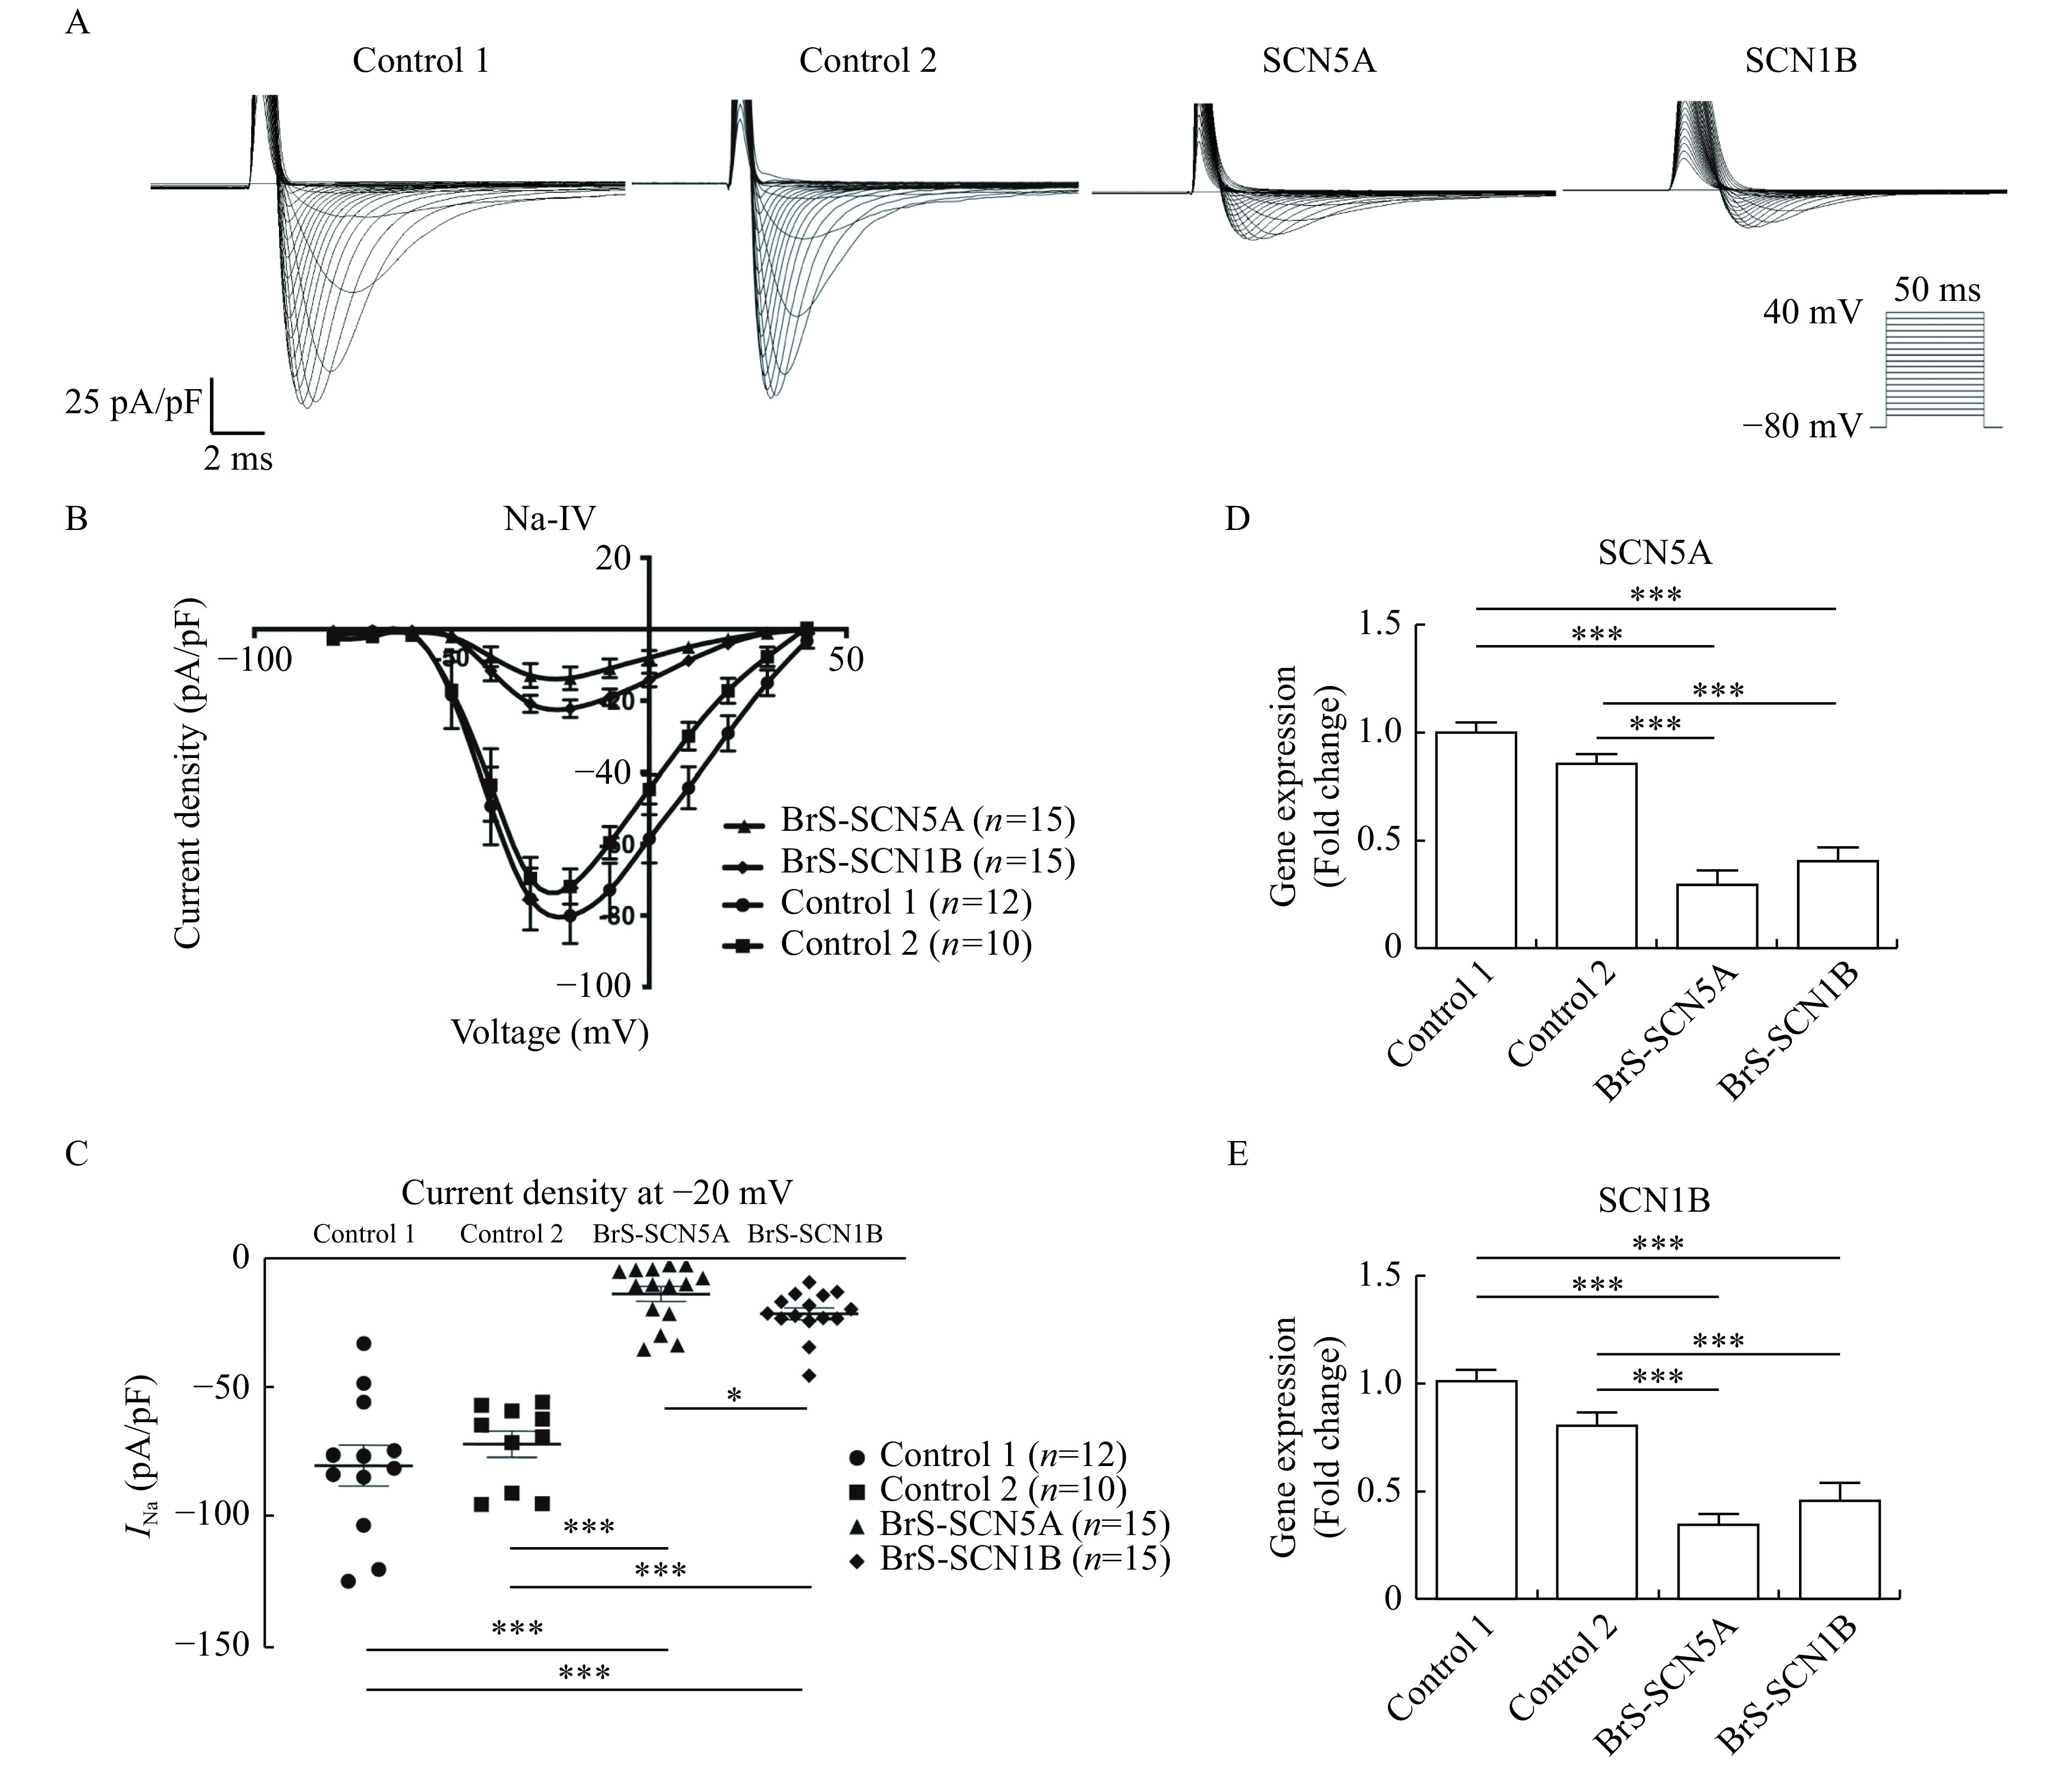
iPSC-CMs carrying SCN5A or SCN1B mutation showed impaired INa properties.
A: Typical INa curve measured by the voltage clamp protocol. Traces for pulses from −80 to −40 mV are shown. B: Current-voltage relationships of INa from Control 1 (n=12), Control 2 (n=10), BrS-SCN5A (n=15), and BrS-SCN1B (n=15) normalized to the cell capacitance. C: Comparison of INa density at −20 mV between control lines and the BrS lines. D and E: SCN5A and SCN1B expression evaluated by real-time RT-PCR (n=6 for each line). Data are presented as mean±SEM. Comparisons between two groups were analyzed using Student's t-test. ***P<0.001,*P<0.05. iPSC-CMs: induced pluripotent stem cell-derived cardiomyocytes;INa: sodium current.