
Figure 4.
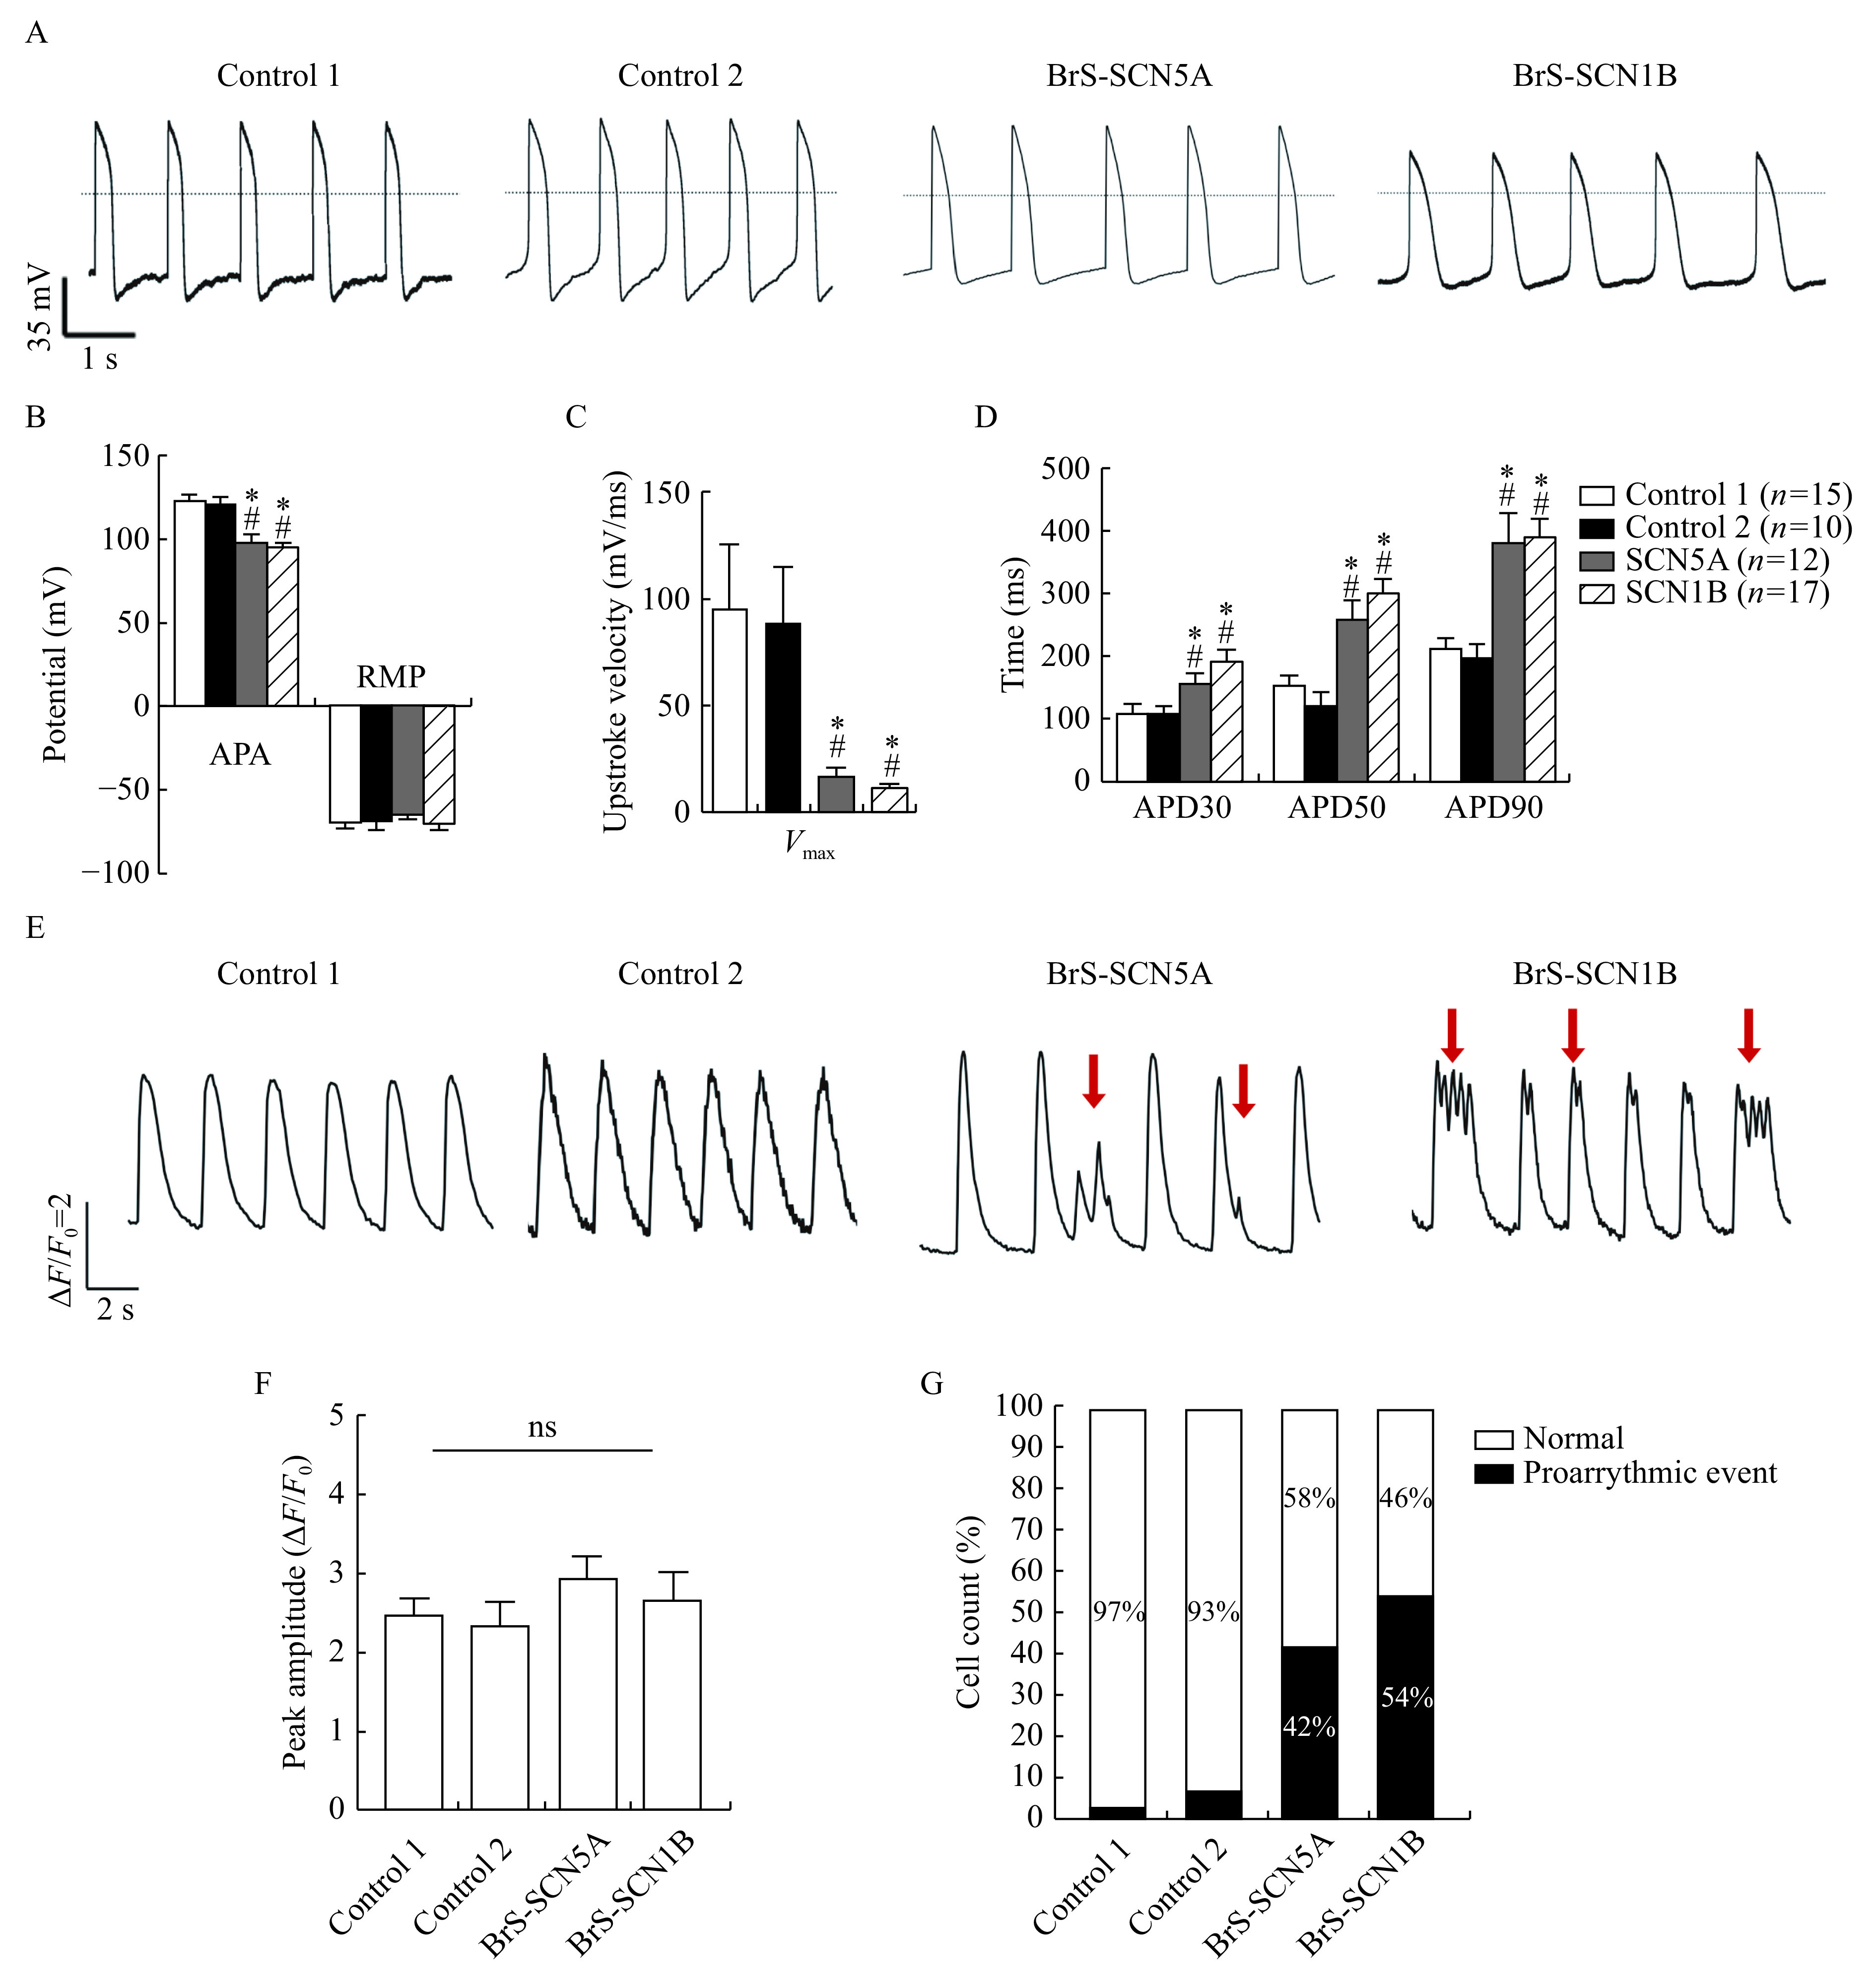
Both BrS iPSC-CMs exhibited prolonged action potential durations, decreased Vmax and abnormal Ca2+ handling.
A: Representative spontaneous AP traces in control and BrS myocytes using current-clamp recording. Dotted line indicates 0 mV. B–D: Mean values for APA, RMP, Vmax, and APD at 30%, 50%, and 90% repolarization (APD30, APD50, and APD90). Control1: n=15; Control2: n=10; BrS-SCN5A: n=12; BrS-SCN1B: n=17. *P<0.01 vs. Control 1; #P<0.01 vs. Control 2. Data are presented as mean±SEM. Comparisons between two groups were analyzed using two-sided Student's t-test. E: Representative spontaneous Ca2+ transients, red arrow indicates irregular Ca2+ waveforms. F: Peak amplitude of spontaneous Ca2+ transients in control and BrS iPSC-CMs (n=30 for each line, Student's t-test). Ns: No significance (P>0.05). G: Proportions of cells showing proarrhythmic events in each line (n=30 for each line, Chi-square test). iPSC-CMs: induced pluripotent stem cell-derived cardiomyocytes; APA: action potential amplitude; RMP: resting membrane potential; Vmax: maximum upstroke velocity; APD: action potential duration.