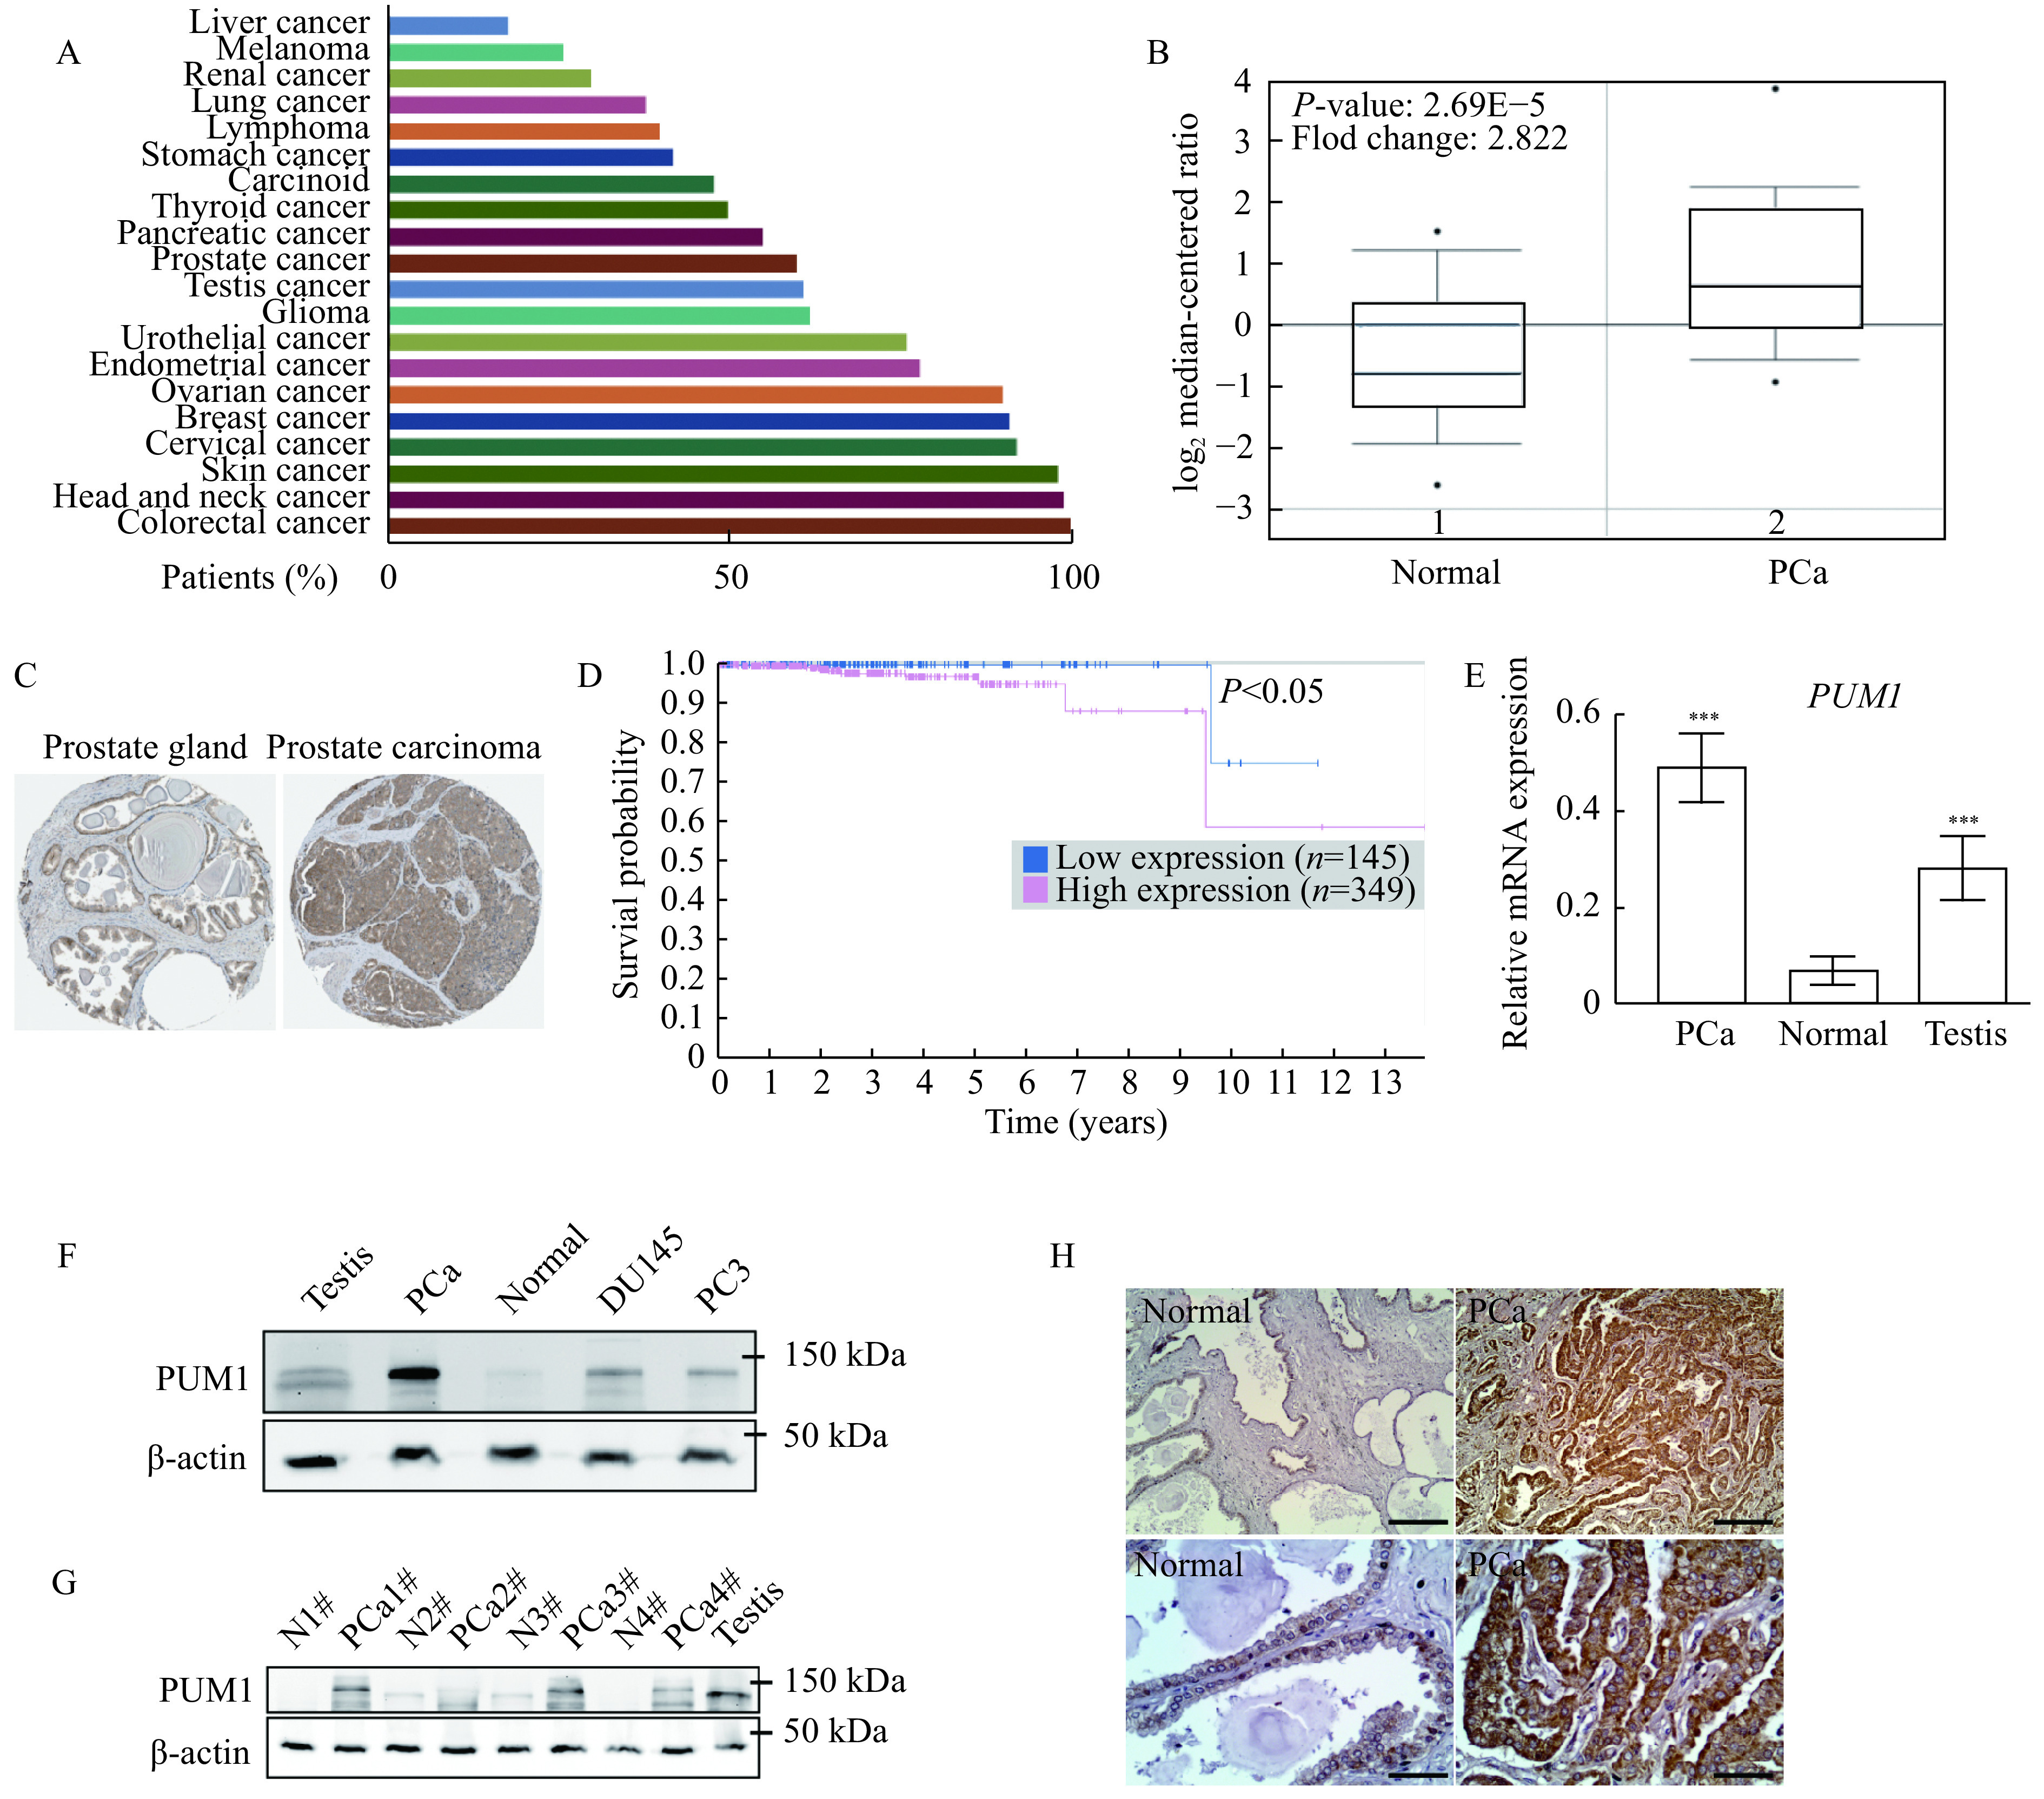
Figure 1.

Overexpression of PUM1 was associated with poor prognosis in patients with PCa.
A: Graph showing the percentage of patients staining positive for PUM1 protein among TCGA cancer types using validated anti-PUM1 antibody from Human Protein Atlas. B: The box plot comparing PUM1 expression in the normal prostate gland (Normal) (n=29) and prostate carcinoma (PCa) (n=72) was derived from the Oncomine database (https://www.oncomine.org/). C: The expression of PUM1 in the normal prostate gland and prostate adenocarcinoma specimens. Representative images were taken from the Human Protein Atlas database. D: The Human Protein Atlas survival analysis for low and high expression levels of PUM1 on 494 prostate cancer patients with death outcome. E: The expression of PUM1 mRNA in prostate cancer tissue (PCa, n=5) and normal prostate tissues (Normal, n=5) was examined by qRT-PCR analysis. Human testis is a positive control since PUM1 is highly expressed in the testis. Data are presented as mean±SD. Comparisons between each two groups were analyzed using a two-tailed Student's t-test, ***P<0.001. F: PUM1 protein in prostate cancer cell lines (DU145 and PC3) and tumor tissue from one cancer patient was detected by Western blotting analysis. G: PUM1 protein level was detected in adjacent normal tissue (Normal,n=4) and prostate carcinoma tissue (PCa, n=4) of different cases. H: Immunohistochemistry of PUM1 protein in prostate carcinoma (PCa, n=10) and normal prostate gland (Normal, n=10). Scale bar: 200 μm (upper panel) and 50 μm (lower panel).
