Figure 4.

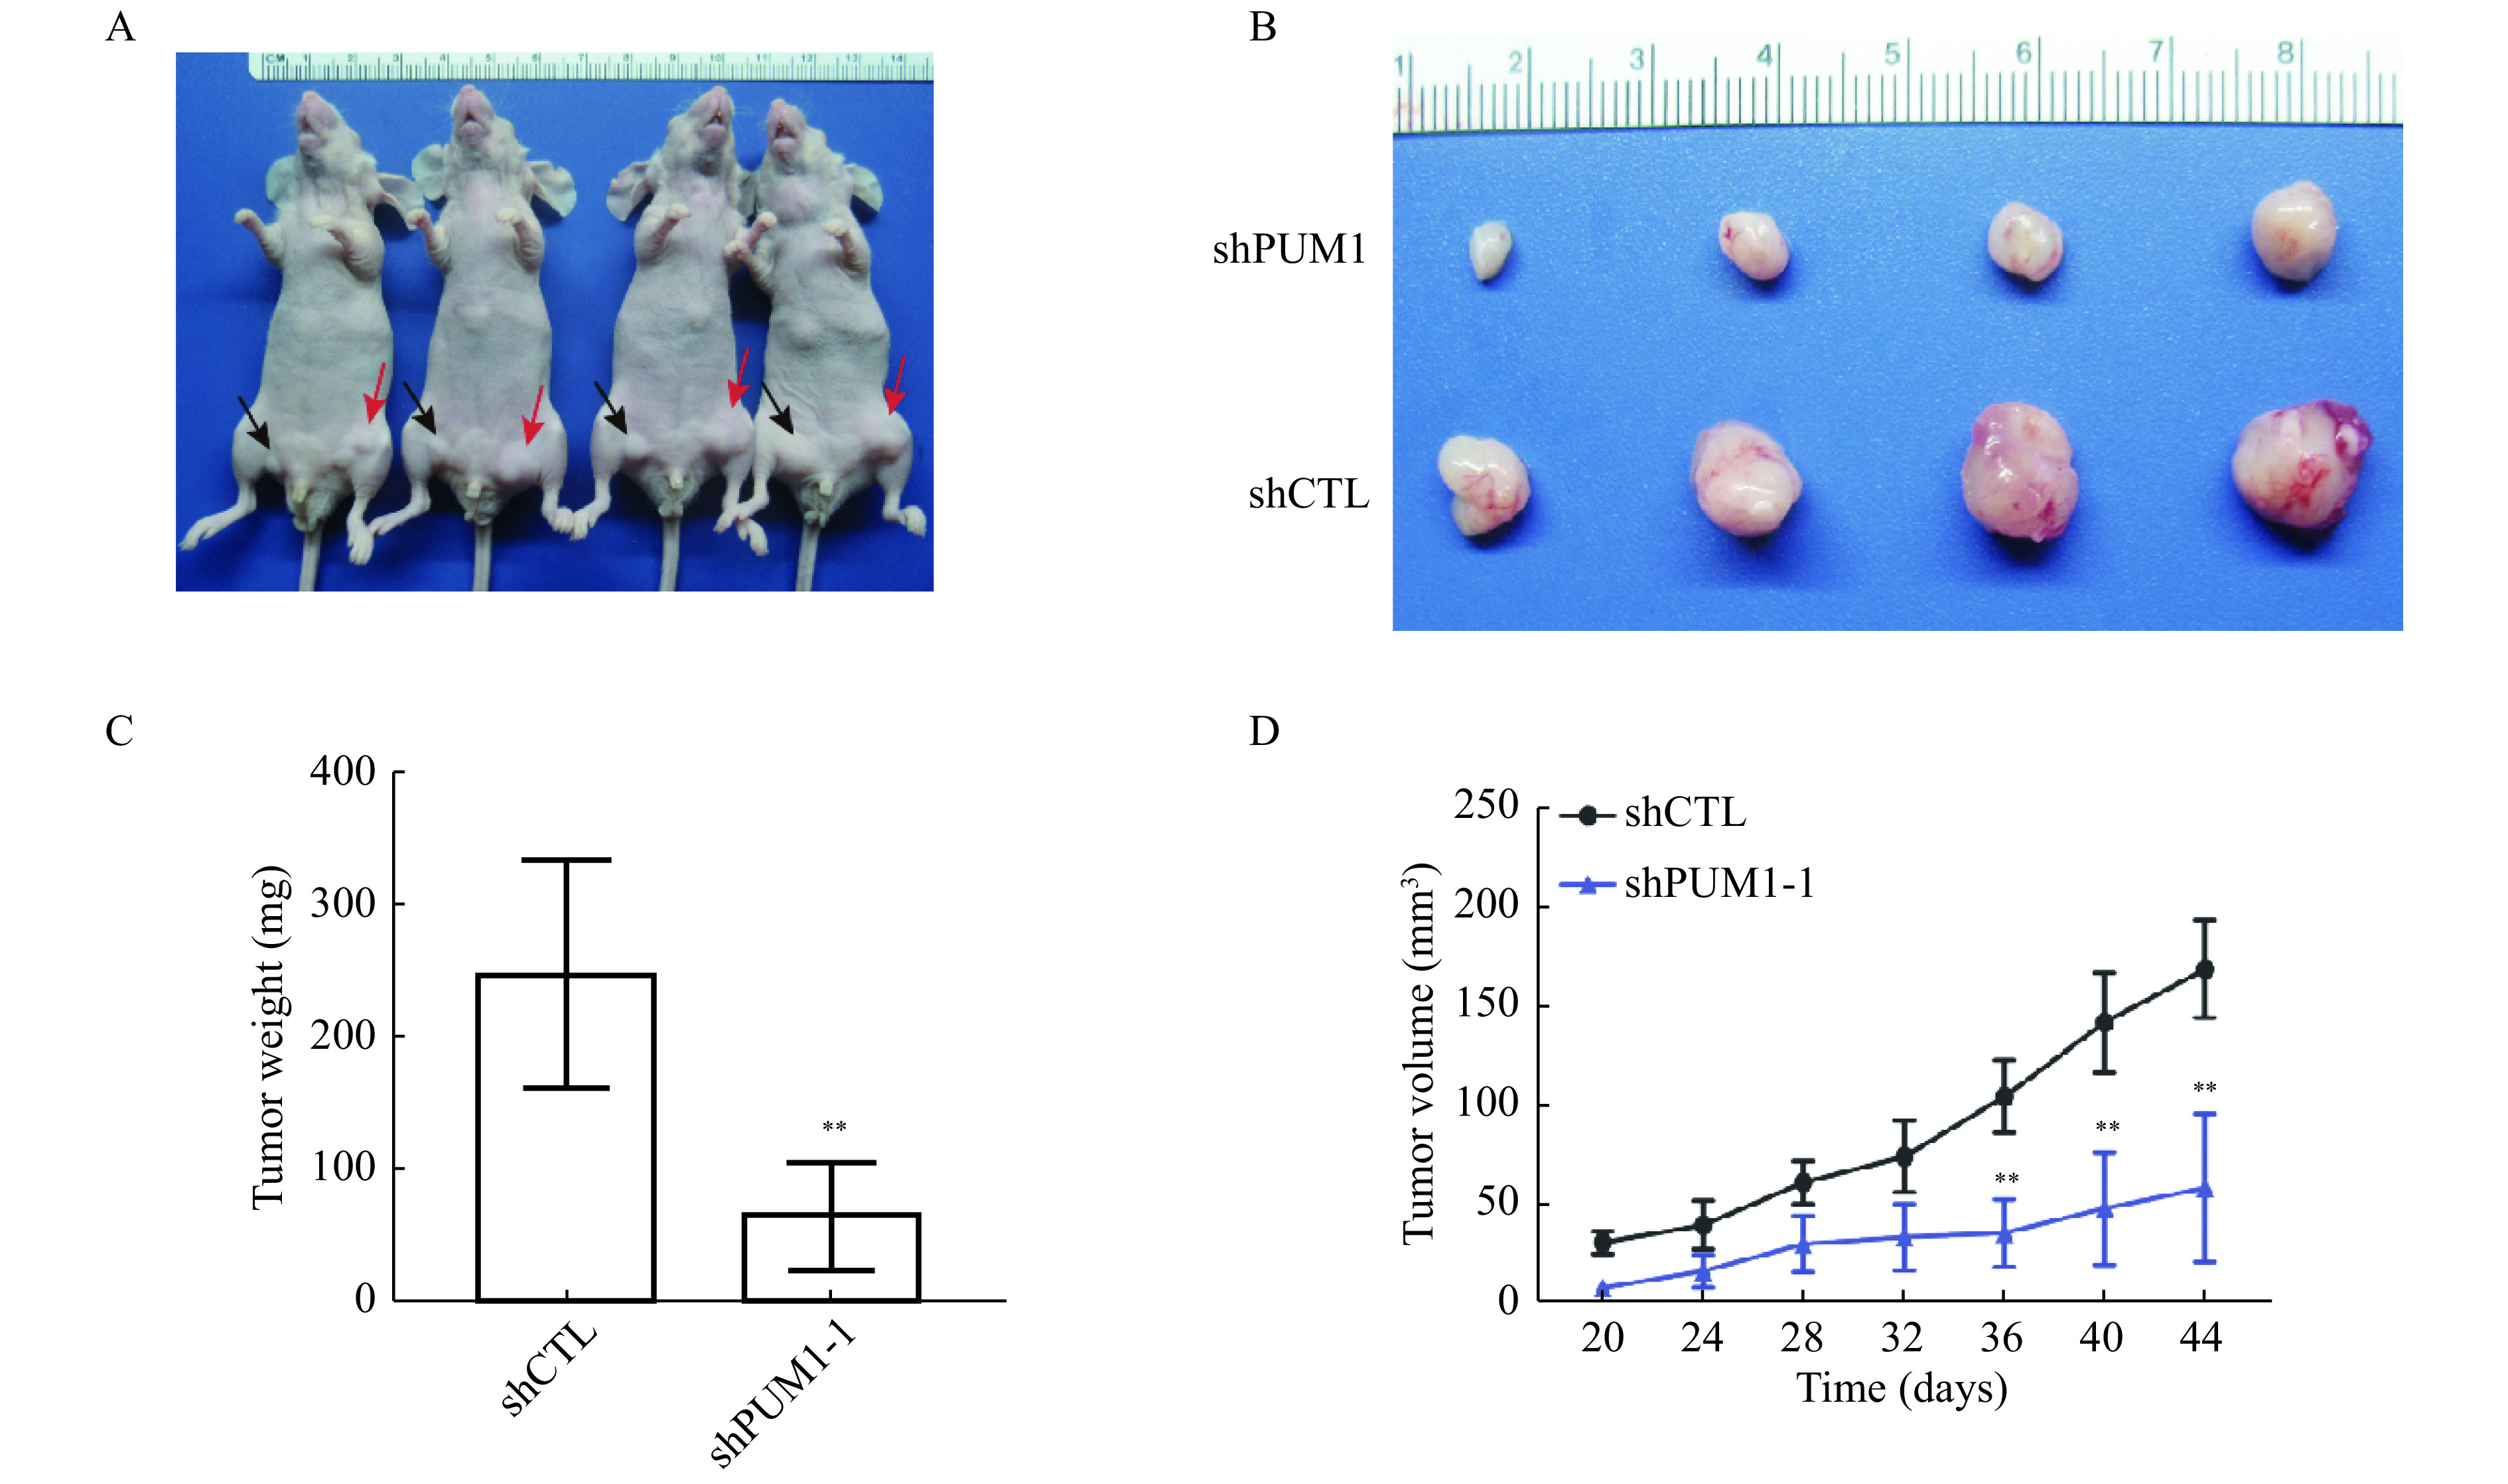
Knockdown PUM1 reduced tumorigenesis of DU145 cells in vivo.
A and B: Representative images of xenografted nude mice (A) and tumors formed from PUM1 knockdown cells and control cells (B). The black arrowhead indicates PUM1 knockdown cells, and the red arrow indicates control cells. C: Tumors from each group of mice were dissected and weighed for comparison of PUM1 knockdown and shCTL. Data are shown as mean±SD (n=4 mice in each group; unpaired t-test; **P<0.01vs. shCTL group). D: Tumor volumes from each group of mice were measured on the indicated days. Data are presented as mean±SD. Statistical analyses were performed using unpaired Student's t-test. **P<0.01vs. shCTL group.
