
Figure 3.
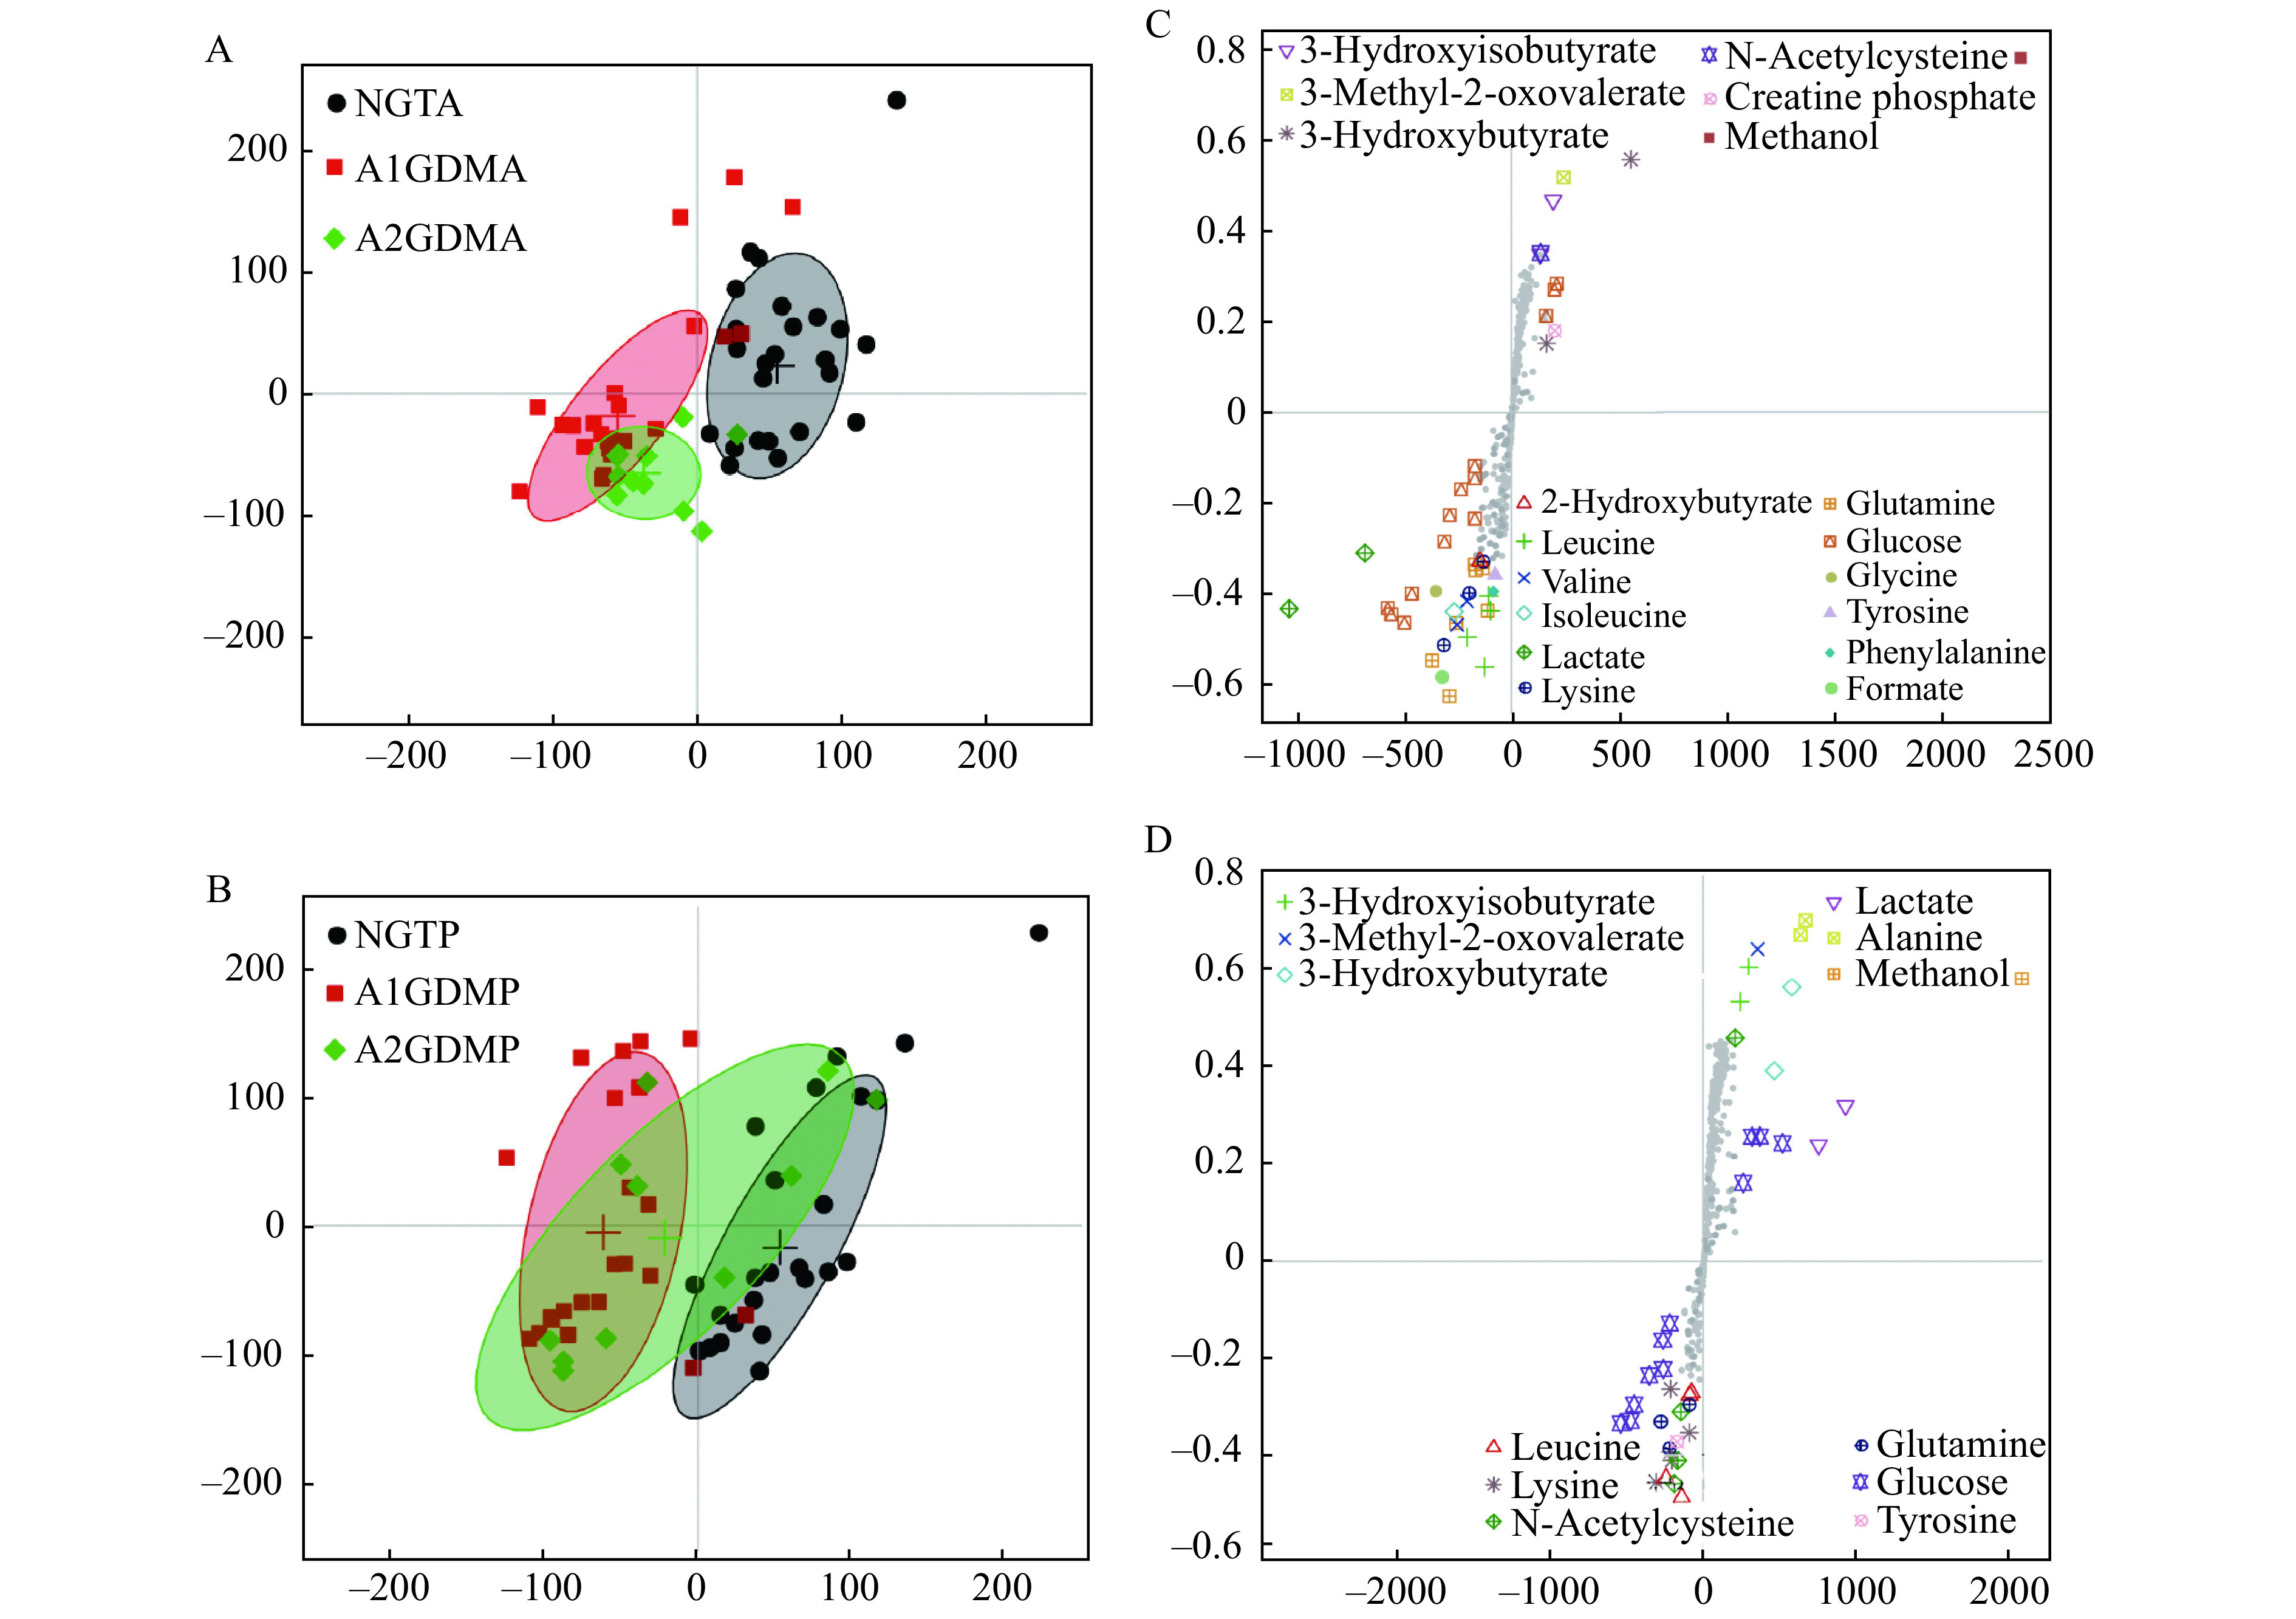
OPLS-DA score plot and mean score trajectory of plasma 1H-NMR spectra obtained from antepartum and postpartum NGT/A1GDM/A2GDM patients.
A: The OPLS-DA score plot between NGTA (n=35), A1GDMA (n=24), and A2GDMA (n=11) groups. B: The OPLS-DA score plot between NGTP (n=35), A1GDMP (n=24), and A2GDMP (n=11) groups. C and D: Metabolites with significant contribution to the clustering were showcased in the score plot. NGTA: antepartum NGT group; NGTP: postpartum NGT group; A1GDMA: antepartum A1GDM group; A1GDMP: postpartum A1GDM group; A2GDMA: antepartum A2GDM group; A2GDMP: postpartum A2GDM group; OPLS-DA: orthogonal partial least squares discriminant analysis.