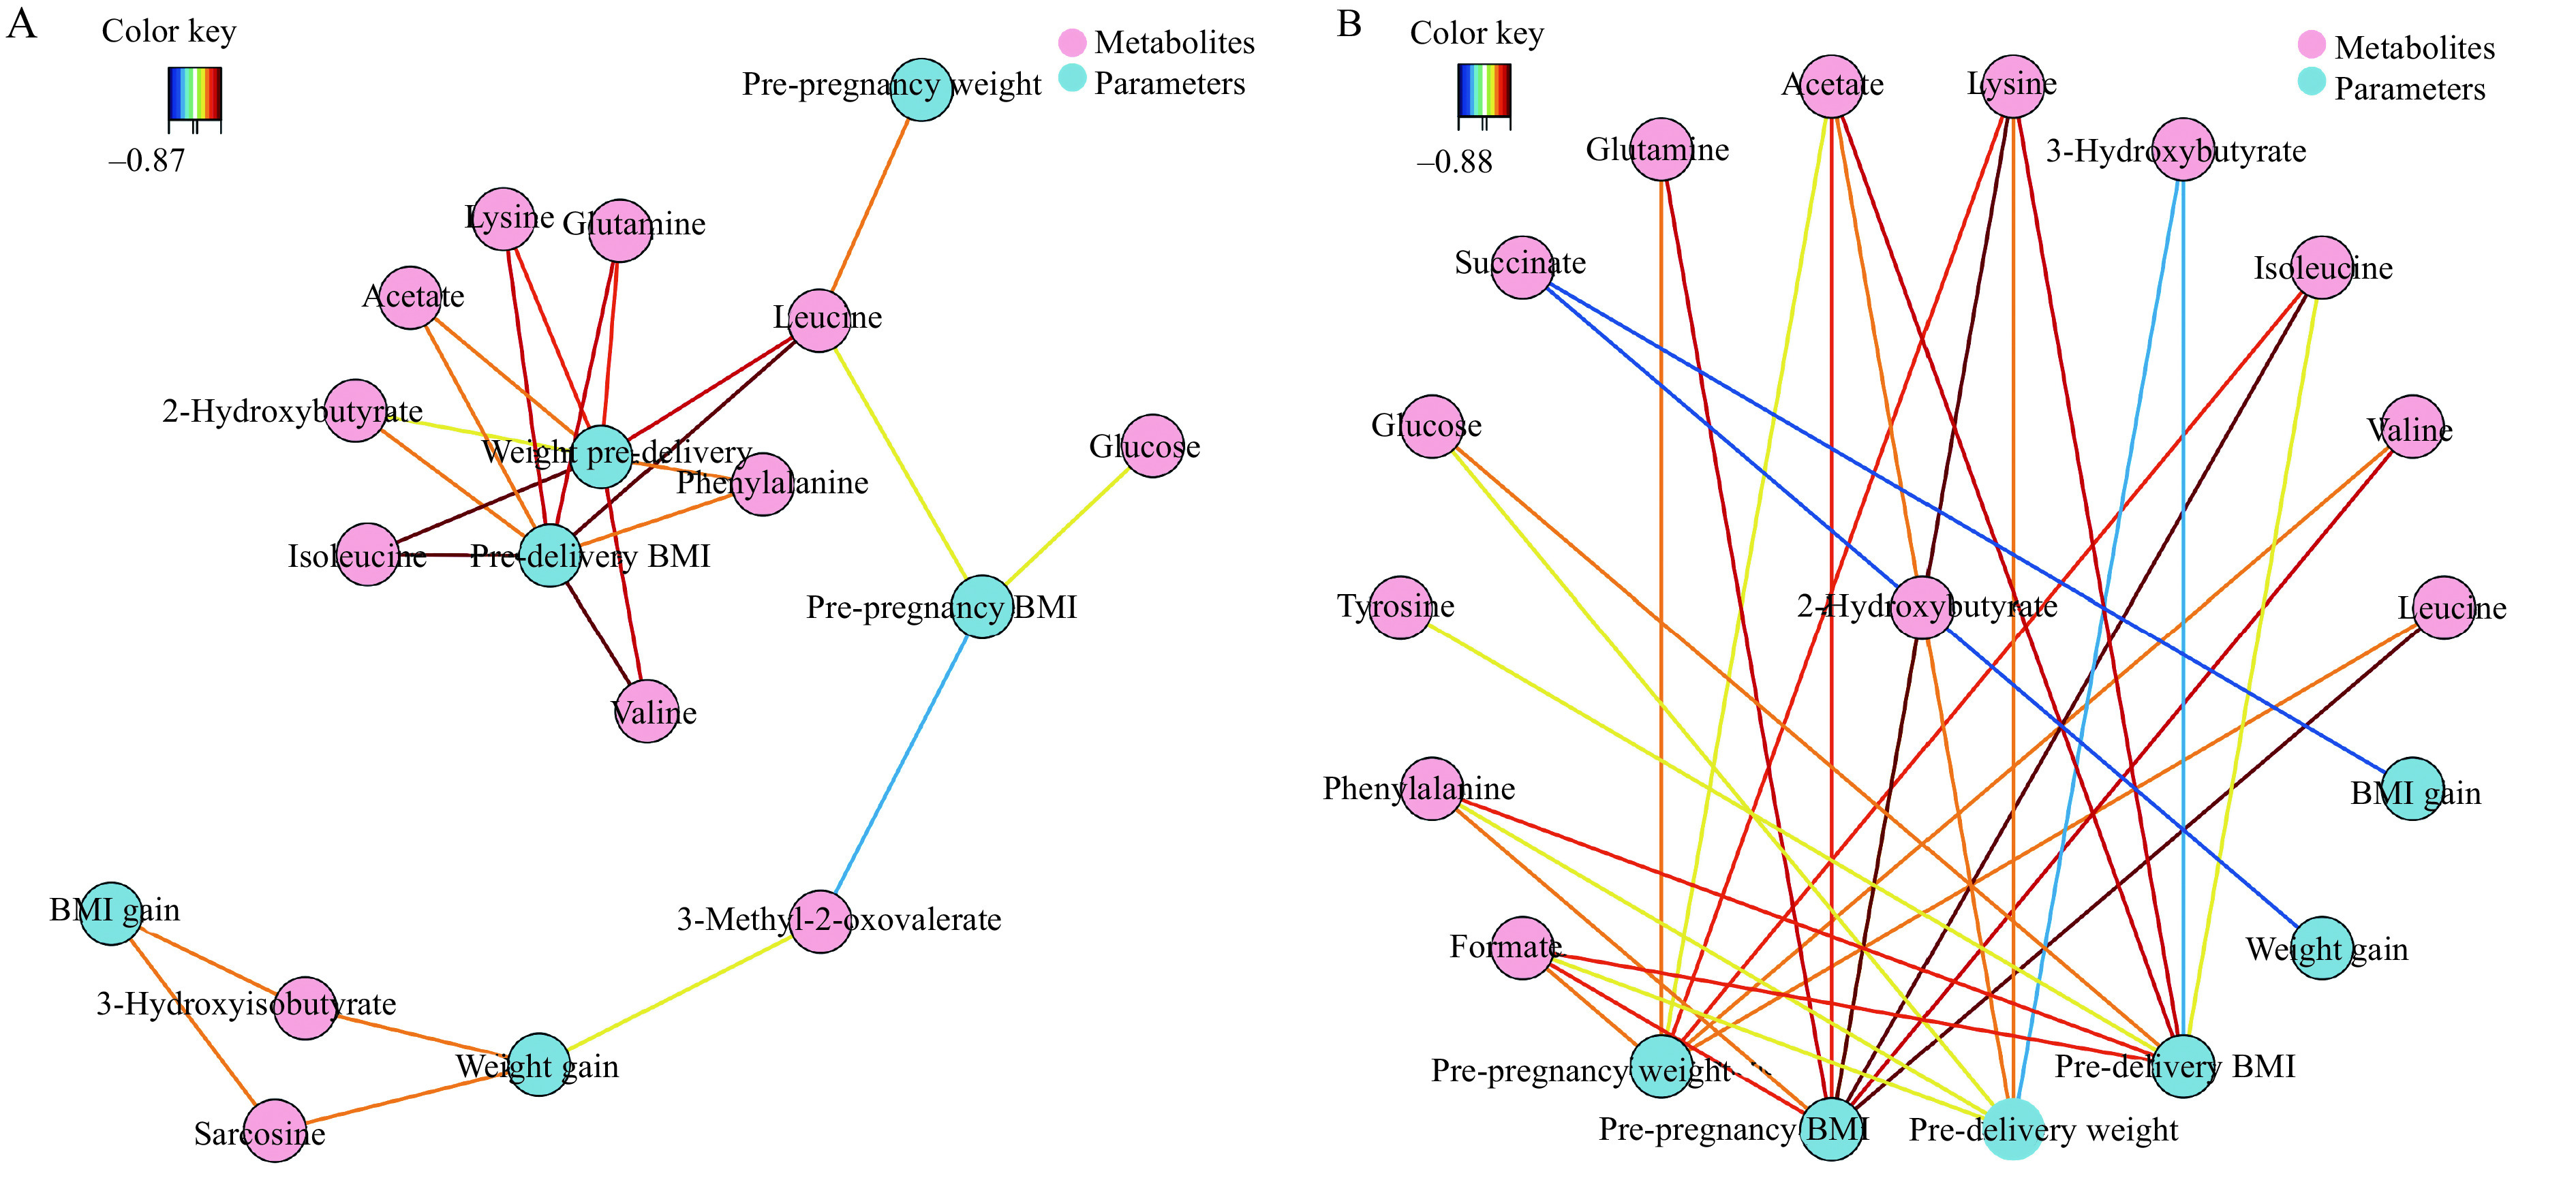
Figure 5.

Correlation network between metabolites and demographic parameters.
The network is represented with metabolites and other parameters as nodes (framed in circle). The colored lines indicate correlations (red for positive and blue for negative correlations, color coded according to the correlation coefficients), and the dotted lines represent the compounds of a similar structure. Only correlations with absolute values of correlation coefficients above the threshold (0.65) were shown. A: Correlation network of metabolites with BMI and weight in antepartum period at the threshold of 0.65. B: Correlation network of metabolites with BMI and weight in postpartum period at the threshold of 0.65.
