
FIGURE 13.
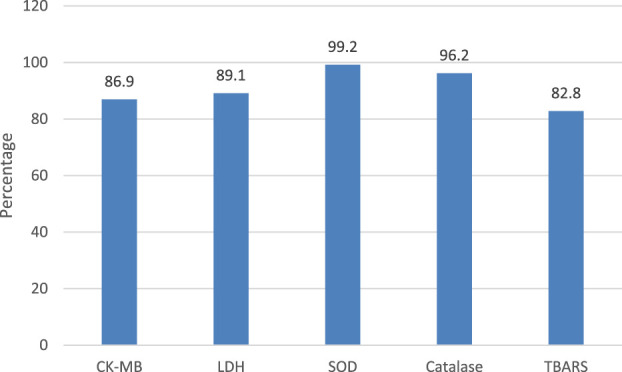
Power Analysis of parameters with low sample size Values are given in percentage, analyzed using G power application, One way ANOVA and Post-hoc test with α error probability of 0.05 and a total sample size of 33 in eleven groups.
Official websites use .gov
A
.gov website belongs to an official
government organization in the United States.
Secure .gov websites use HTTPS
A lock (
) or https:// means you've safely
connected to the .gov website. Share sensitive
information only on official, secure websites.
Power Analysis of parameters with low sample size Values are given in percentage, analyzed using G power application, One way ANOVA and Post-hoc test with α error probability of 0.05 and a total sample size of 33 in eleven groups.