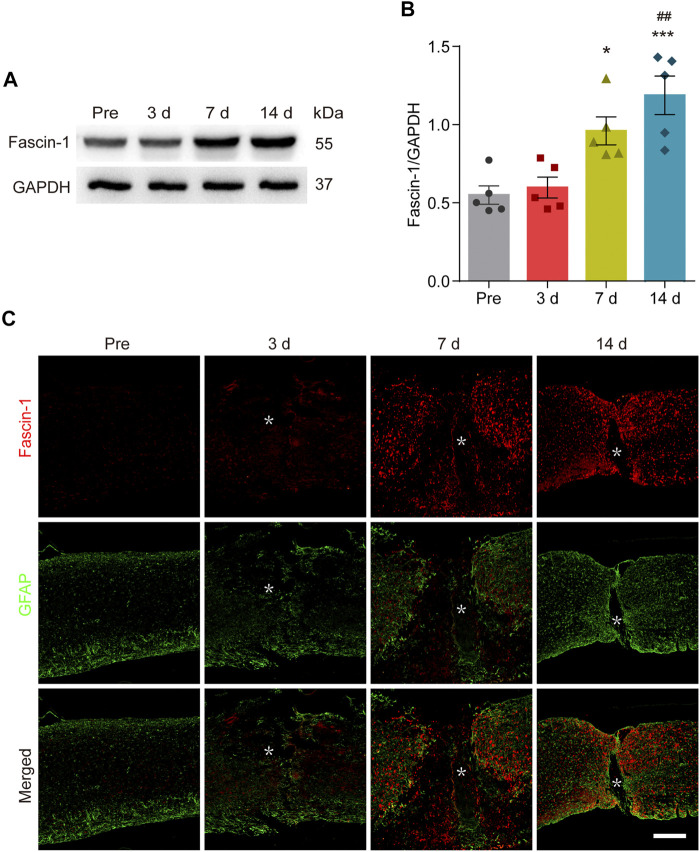
FIGURE 1.
Fascin-1 is prominently expressed and accumulates outside the lesion core after SCI. (A) Western blot analysis shows significant upregulation of Fascin-1 at 7 and 14 days after injury compared to the control (pre-operation, Pre). (B) Quantitative analysis of Fascin-1 expression in (A). The blots (n = 5 per group) were quantified by a densitometric method using ImageJ software. GAPDH was used as the loading control. The results are expressed as the mean ± SEM. ***p < 0.001 (14 days vs Pre); * p < 0.05 (7 days vs Pre); ##p < 0.01 (14 vs 3 days). (C) Double immunofluorescence labeling of spinal cord sagittal sections showing the spatiotemporal distribution of Fascin-1 (Red) and GFAP (Green) at Pre and 3, 7, and 14 days after injury. The asterisks indicate the lesion epicenter. Scale bar: 500 μm.

