FIGURE 3.
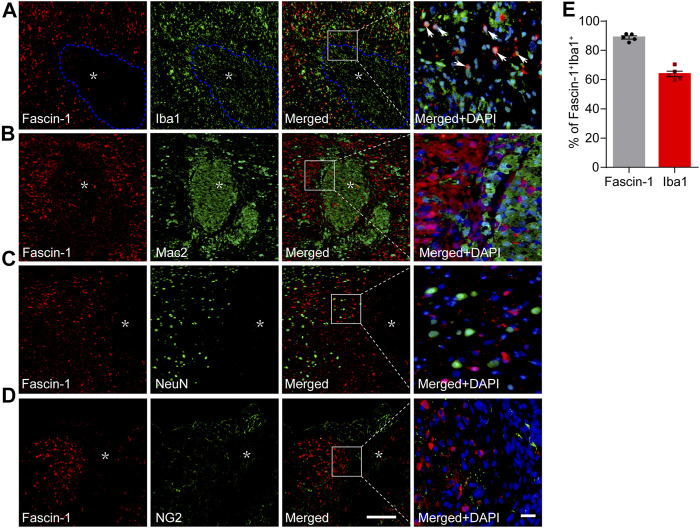
Fascin-1 is expressed partly in Iba1+ cells around the lesion but not in infiltrating Mac2+ macrophages, NeuN+ neurons or NG2+ cells in the injured spinal cord at 14 days. (A) Representative immunofluorescence images of Fascin-1 (Red) and Iba1 (Green). Arrowheads indicate the colocalization observed with a ×40 objective lens. The blue dotted lines delineate the boundary around the lesion core. (B–D) Representative immunofluorescence images of Fascin-1 (Red) staining with Mac2, NeuN, and NG2 (Green) staining, respectively, showing no apparent colocalization of staining. The asterisks indicate the lesion epicenter. Nuclear staining with DAPI is shown (Blue). Scale bars: low magnification, 200 μm; higher magnification, 20 μm. (E) Percentage of Fascin-1+Iba1+ cells relative to the total number of Fasicn-1+ or Iba1+ cells outside the blue dotted lines in the injured spinal cord. The data are presented as the mean ± SEM (n = 5 independent experiments).

