FIGURE 6.
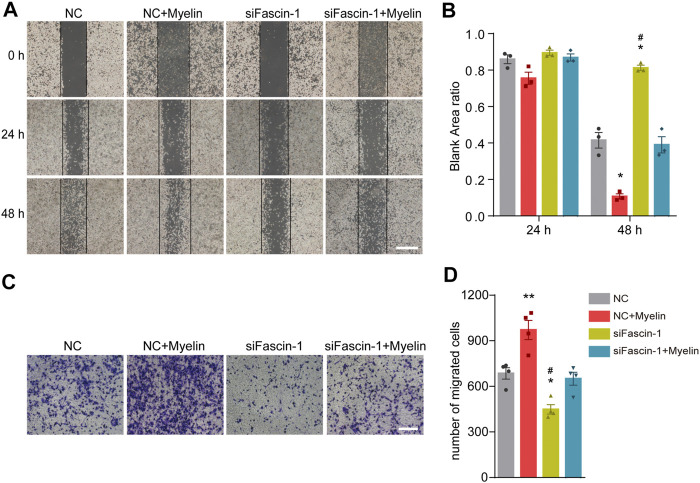
Fascin-1 promotes the migration of microglia in vitro. (A) For the scratch assay, cell migration was recorded at 0, 24 and 48 h after scratching (n = 3 per group). BV-2 cells were transfected with nonspecific control (NC) or Fascin-1 (siFascin-1) siRNA for 24 h and treated with or without myelin for an additional 24 h in complete medium. Scale bar: 2 mm. (B) Quantification of the ratio of the blank area in the scratch migration assay. The results are presented as the mean ± SEM of experiments conducted in triplicate. * p < 0.05 (NC + Myelin or siFascin-1 vs NC); # p < 0.05 (NC + Myelin vs siFascin-1). (C) Transwell assays were used to detect the migration of microglia. BV-2 cells were treated as described in (A). After 48 h, the cells were resuspended in serum-free media and added to the upper chamber. Then, the cells were allowed to migrate for an additional 12 h and stained with crystal violet. Scale bar: 200 μm. (D) Quantitative analysis of the number of transmembrane cells in (C) (n = 4 per group). The results are presented as the mean ± SEM. **p < 0.01 (NC + Myelin vs NC), * p < 0.05 (siFascin-1 vs NC). # p < 0.05 (siFascin-1 vs siFascin-1+Myelin).

