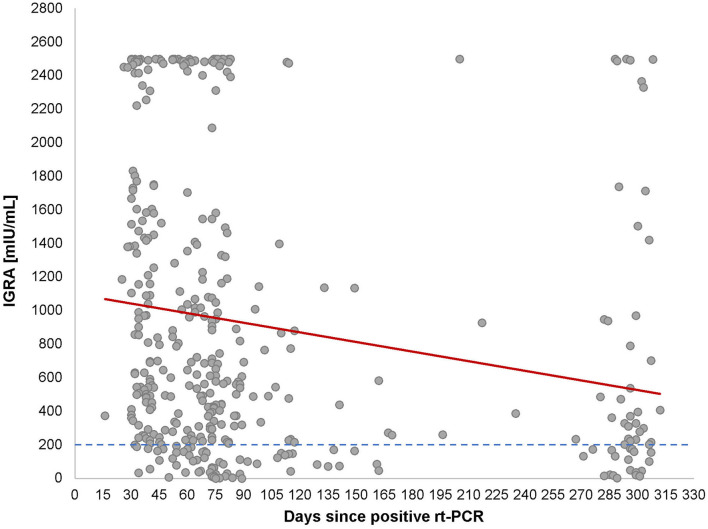
Figure 3.
Correlation between Interferon Gamma Release Assay (IGRA) and time after COVID-19 infection. Cross-sectional representation for IGRA values at different time-points for 320 individuals. Each black dot represents one participant and the IGRA milli-international units per milliliter (mIU/ml) and the red line represents the interpretation line, which shows the negative linear association between IGRA values and the days passed since the diagnosis of COVID-19. The dotted line represents the cut-off of IGRA values at 200 (mIU/ml).

