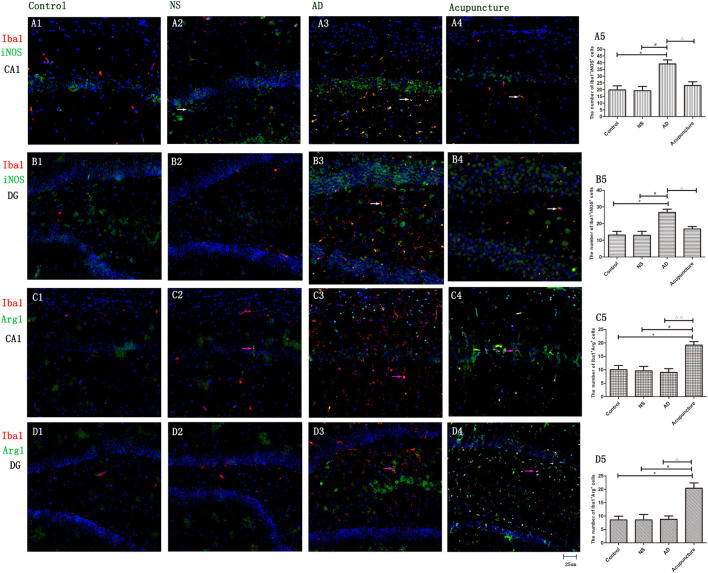
FIGURE 3.
The microglia polarization in different groups. (A1–4) Microglia of CA1 was double-stained with anti-iNOS and anti-Iba1 antibody and was observed on fluorescent image. (Red expresses Iba1-positive cells, green expresses iNOS-positive cells, and blue expresses DAPI. The white arrow expresses iNOS+Iba1+ cells.) (B1–4) Microglia of DG was double-stained with anti-iNOS and anti-Iba1 antibody and was observed on fluorescent image (Red expresses Iba1-positive cells, green expresses iNOS-positive cells, and blue expresses DAPI. The white arrow expresses iNOS+Iba1+ cells.) (C1–4) Microglia of CA1 was double-stained with anti-Arg1 and anti-Iba1 antibody and was observed on fluorescent image. (Red expresses Iba1-positive cells, green expresses Arg1-positive cells, and blue expresses DAPI. The pink arrow expresses iNOS+Iba1+ cells.) (D1–4) Microglia of DG was double-stained with anti-Arg1 and anti-Iba1 antibody and was observed on fluorescent image (Red expresses Iba1-positive cells, green expresses Arg1-positive cells, and blue expresses DAPI. The pink arrow expresses iNOS+Iba1+ cells.) (A5,B5,C5,D5) The number of positive stained cells in four groups. Error bars: SE. Compared with Control group, *p < 0.05; compared with NS group, #p < 0.05; compared with AD group, △p < 0.05, △△p < 0.01 (n = 5).

