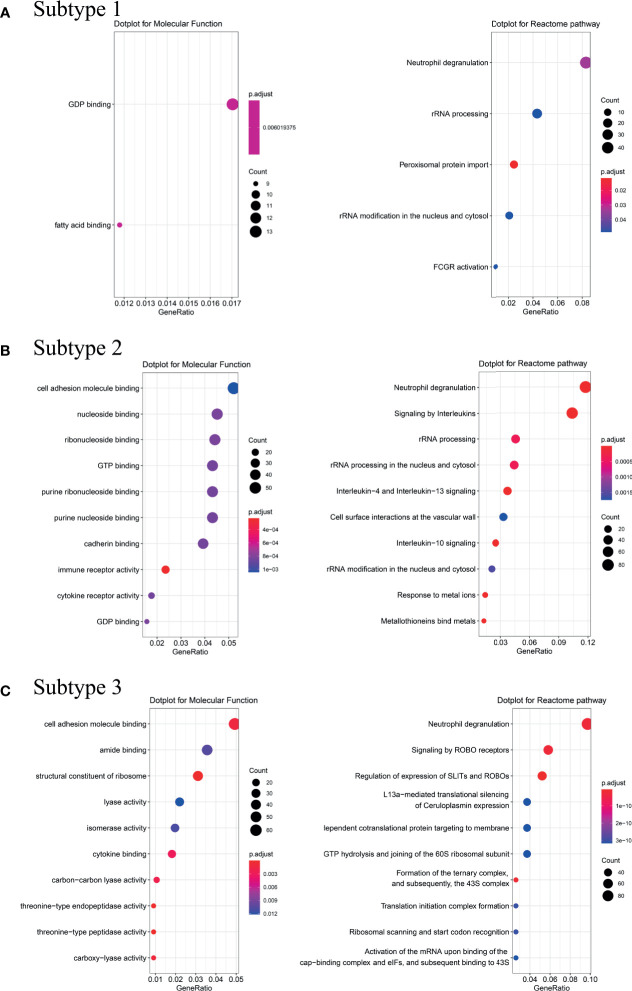
Figure 4.
Analysis of Molecular Function and Reactome pathway. Molecular Function enrichment and Reactome pathway analysis were performed on the representative genes of the Subtype 1 (A), Subtype 2 (B) and Subtype 3 (C). Counts refer to the number of genes enriched into the relevant pathway and the larger the dotplot, the more genes are enriched. Different colors represented different p.adjust.

