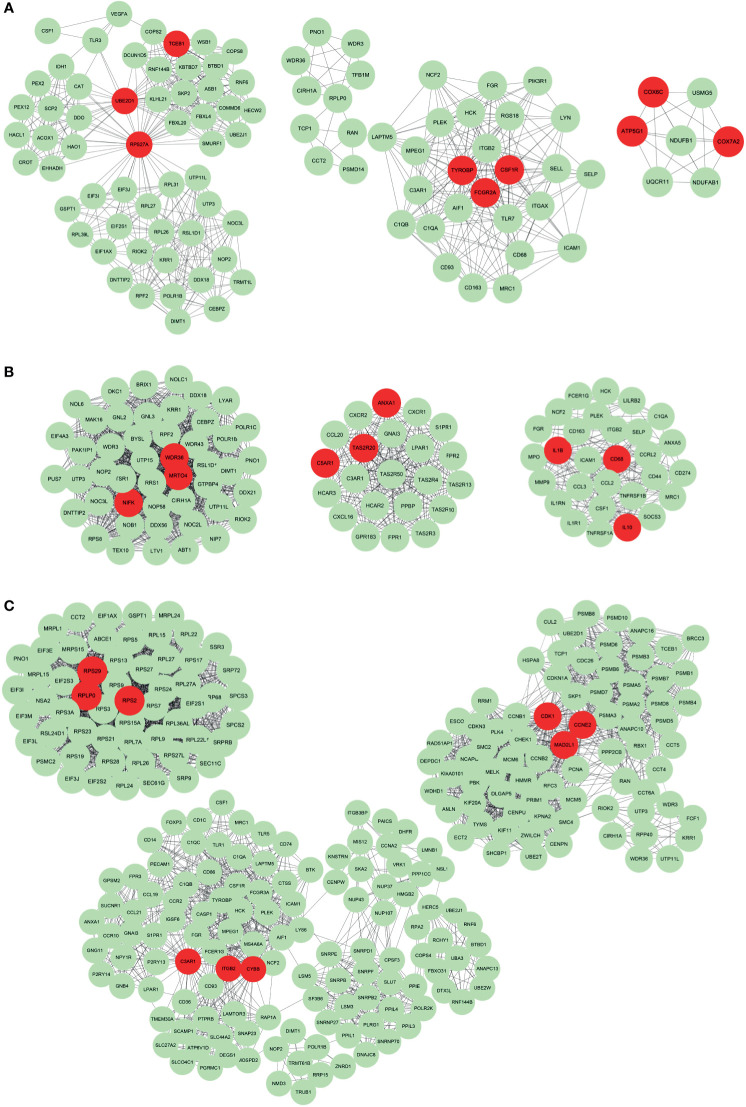
Figure 5.
The protein-protein interaction network of representative genes of each subtype. The Protein-protein interaction network constructed by STRING was imported into Cytoscape for further analysis using the MCODE plug-in. The top 3 clusters from representative genes of Subtype 1 (A), Subtype 2 (B) and Subtype 3 (C) are illustrated and related hub genes (red color) in each clusters were obtained from degree values.

