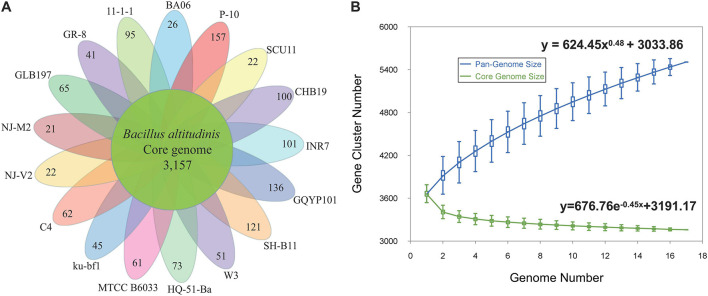
FIGURE 3.
The pan-genomes of 17 B. altitudinis strains. (A) The number of unique CDS for each strain of the B. altitudinis pan-genome. The inner circle shows the core genomes shared between all strains. The specific genes for each strain are indicated in each of the outer circles. (B) Curves for B. altitudinis pan-genomes and core genomes. The blue dots denote the B. altitudinis pan-genome size for each genome comparison whereas the green dots indicate the B. altitudinis core genome size for each genome comparison. The median values were connected to represent the relationship between number of genomes and gene families.

