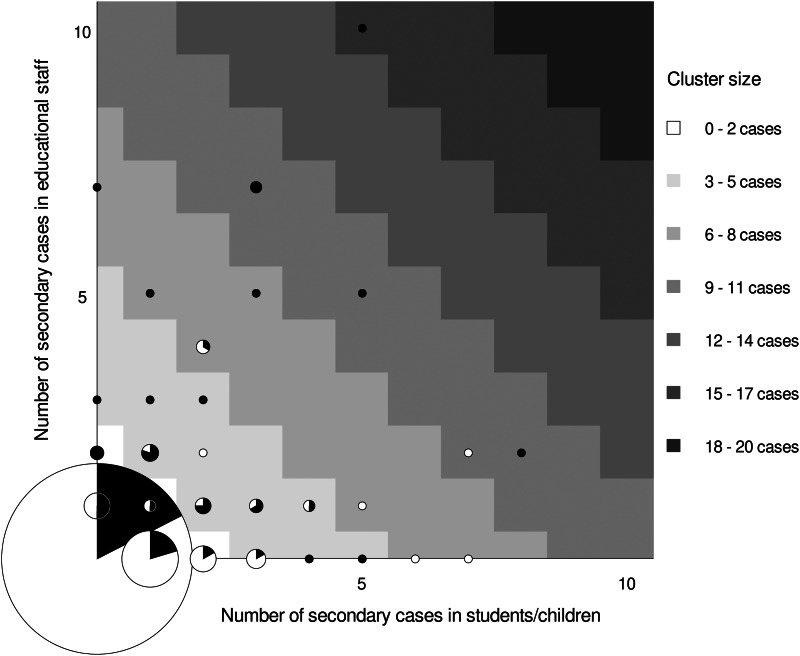
Fig. 2.
Frequency of secondary cases in children and teachers by the role of SARS-CoV-2-PCR positive index case. Graph displays frequency and role of 784 index cases and their association with secondary transmission to teachers and students/children in schools and day-care centres in Rhineland-Palatinate, Germany, 2020. Grid position of circles represents the number of secondary cases in students/children (x-axis) and teachers (y-axis). The circle size is proportional to the number of index cases with a particular number of secondary cases observed in this study. The colour inside the circle represents the share of children (white) and teachers (black) observed among index cases represented by that circle. Circles in areas of the grid with the same shade of grey represent clusters of similar size. For instance, the black dot at the very top of the grid identifies one cluster of size 15 (high cluster size = dark shade of grey) that emerged around a teacher index case (indicated by black colour vs. white colour of dot) and led to the identification of 10 secondary cases in teachers (position on y-axis) and 5 in student/children (position on x-axis).

