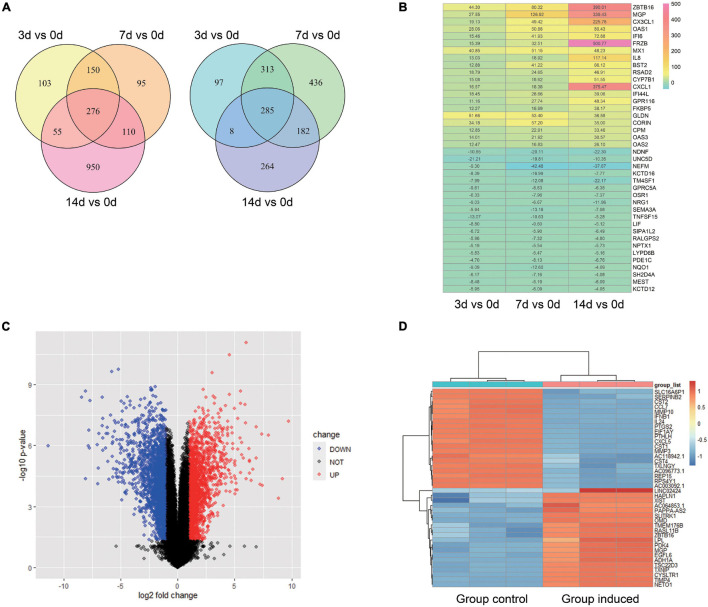
FIGURE 1.
Analysis of differentially expressed genes (DEGs) of GSE99958 and GSE159507. For GSE99958, the CONORS package was used to analyze the differentially expressed genes (DEGs) between the Group induced 3, 7, 14 days and the Group control. A venn graph (A) shows the total 276 up-regulated and 285 down-regulated DEGs and a heat map (B) shows representative DEGs. The number in the heat map grid represents multiples of gene counts. For GSE159507, the limma package was used to analyze the difference genes between the Group induced and the Group control. A volcano plot (C) and heat map (D) reveal the 4,082 DEGs (total 1,908 up-regulated and 2,174 down-regulated DEGs). Red color indicates up-regulated genes, and blue indicates down-regulated genes. Group Control: PDLSCs treated with control medium. Group induced: PDLSCs treated with osteogenic medium.

