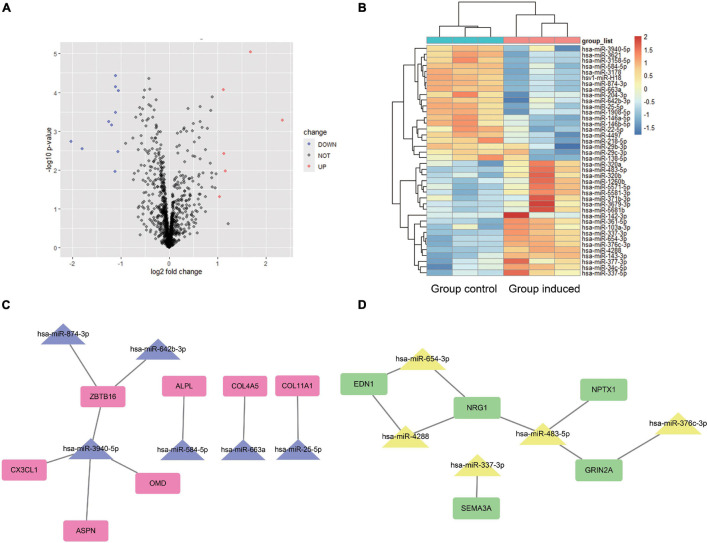
FIGURE 4.
Differentially expressed miRNA analysis and miRNA-mRNA potential interaction network construction. For the miRNA-seq dataset GSE159508, limma package was used to analyze the DEMs between the Group induced and the Group Control. A volcano plot (A) and heat map (B) shows the 16 DEMs. Red color indicates six up-regulated miRNA, and blue indicates 10 down-regulated miRNA. The predicted target genes of DEMs is calculated by miRWalk website. After the predicted target genes of DEMs and the obtained hub genes were intersected, a negatively regulated PPI of miRNA-mRNA network was obtained (C,D). We obtained five up-regulated (miR-337-3p, miR-376c-3p, miR-4288, miR-483-5p, and miR-654-3p) and 6 down-regulated (miR-25-5p, miR-3940-5p, miR-584-5p, miR-642b-3p, miR-663a, and miR-874-3p) DEMs that potentially interacted to hub genes. Group Control: PDLSCs treated with control medium. Group induced: PDLSCs treated with osteogenic medium.

