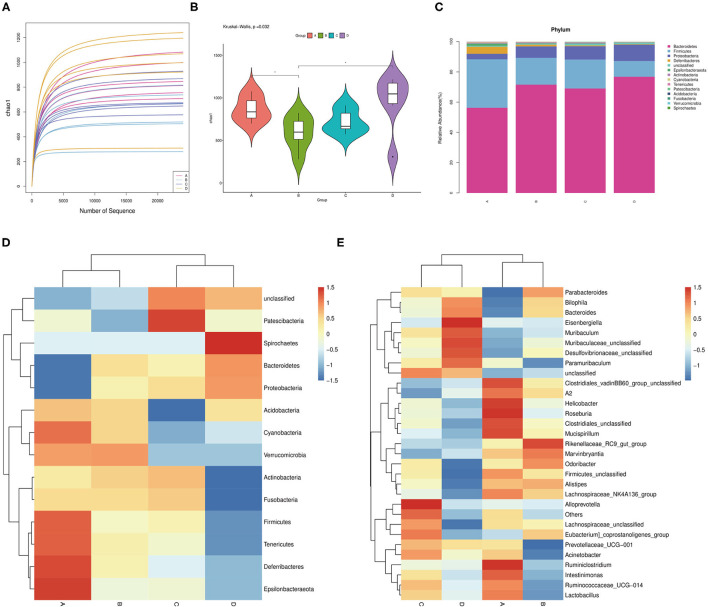
Figure 4.
Microbial community changes in the colon content of mice after probiotic administration. (A) Bacterial rarefaction curves for assessing the sequencing depth of each sample. (B) Alpha diversities in bacterial communities as determined by Chao1 index. (C) Average relative abundances of taxa at the phylum level. (D) Heat map and hierarchical clustering of phylum in the intestinal bacterial communities of mice. (E) Clustering heat map analysis of bacterial genera at the genus level. (A) JT3-1 group, (B) FBL-3a group, (C) ZLP-4b group, and (D) control group.

