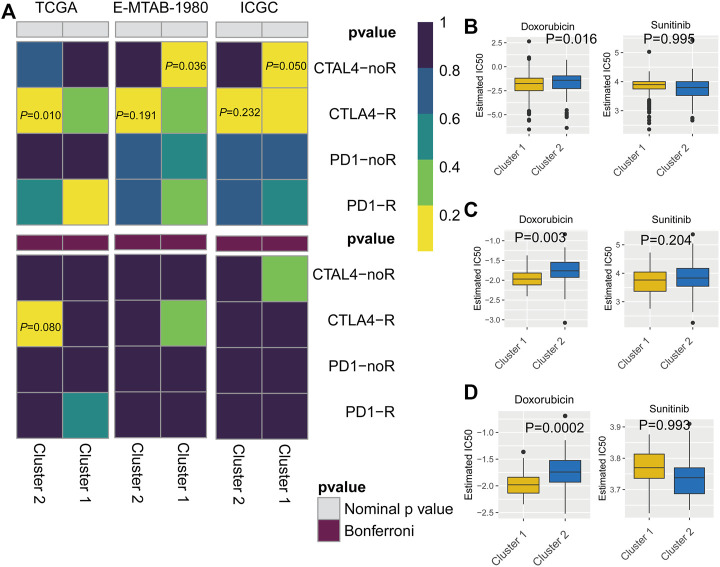
FIGURE 7.
(A) Subclass mapping analysis showed that cluster 2 is sensitive to CTLA4-R. [The Cancer Genome Atlas (TCGA): PCTLA4-R = 0.010; E-MTAB-1980: PCTLA4-R = 0.191; International Cancer Genome Consortium (ICGC): PCTLA4-R = 0.232] Based on corrected p-values, cluster 1 is not sensitive to CTLA4-R. (B) Box plot of estimated IC50 values for sunitinib and doxorubicin in cluster 1 and cluster 2. [(A): TCGA; (B): E-MTAB-1980; (C): International Cancer Genome Consortium (ICGC)].

