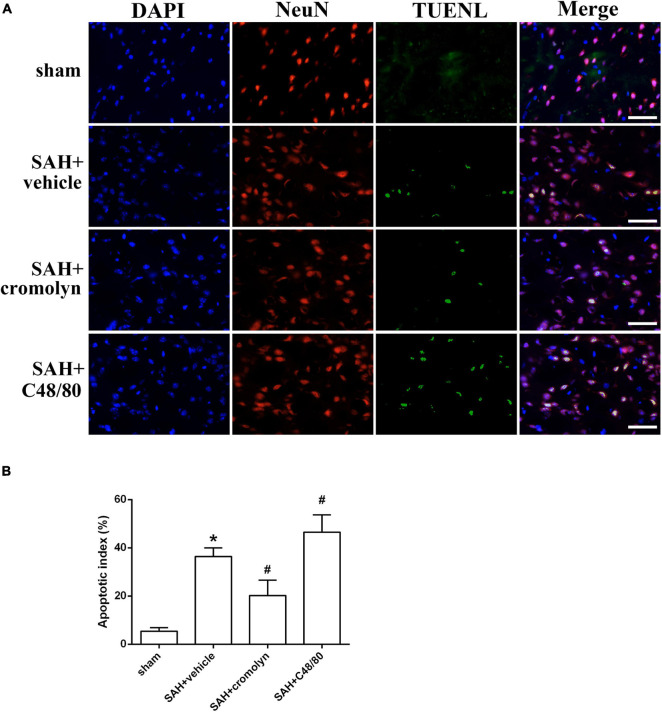
FIGURE 5.
Effect of MCs on SAH-induced neuronal injury. (A) Representative microphotographs showing the co-localization of TUNEL positive cells (green) with NeuN (red) in cortex. (B) The quantitative analysis of TUNEL-positive neurons. Scale bar = 50 μm. n = 6. Data are represented as mean ± SD. *P < 0.05 versus sham group. #P < 0.05 versus SAH + vehicle group.

