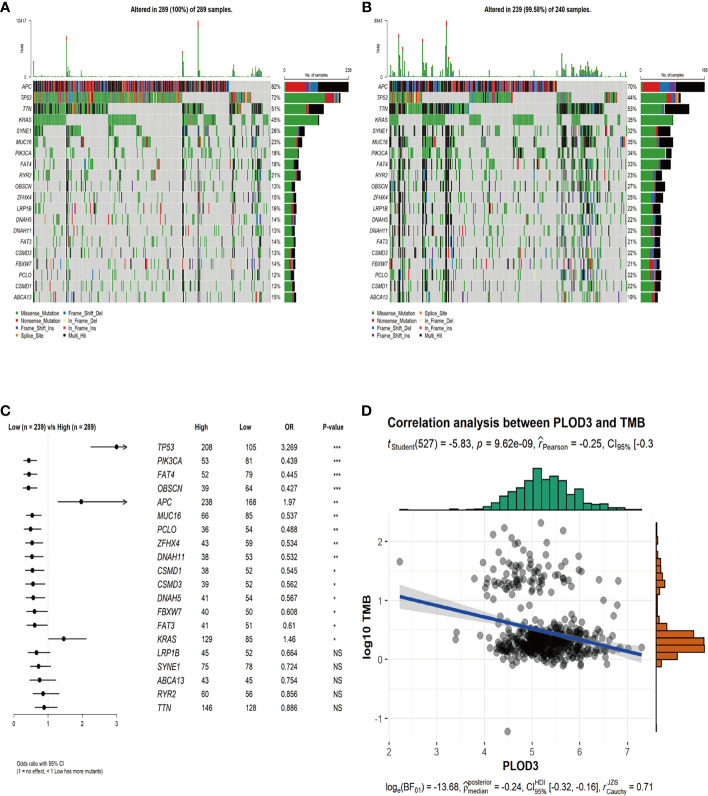
Figure 4.
Genomic mutation profiles and TMB characteristics of PLOD3-high and PLOD3-low groups. (A) Distribution of top 20 frequently mutated genes in PLOD3-high TCGA-CRC subgroups. The upper bar plot shows the TMB for each patient, and the left bar plot indicates the gene mutation frequency in different risk groups. (B) Distribution of top 20 frequently mutated genes in PLOD3-low TCGA-CRC subgroups. The upper bar plot shows the TMB for each patient, and the left bar plot indicates the gene mutation frequency in different risk groups. (C) Differentially mutated genes between PLOD3-high and low groups. The p values were calculated by Fisher’s exact test. *p < 0.05; **p < 0.01; ***p < 0.001, NS, No Significance. (D) Correlation analysis of TMB and PLOD3 in TCGA-CRC cohort.

