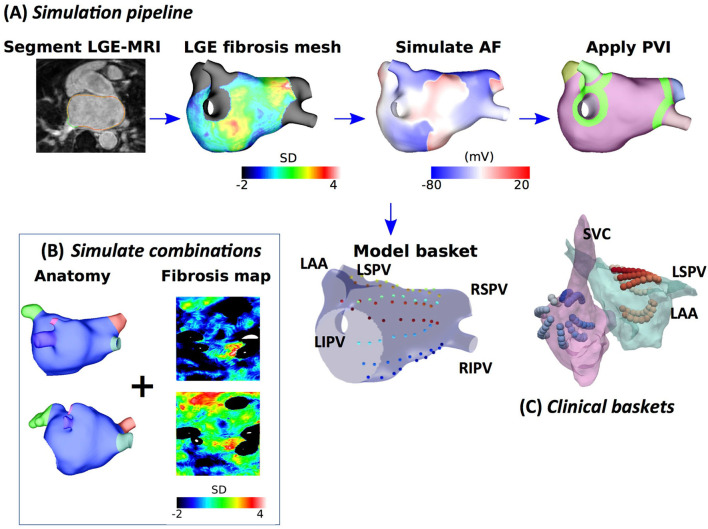
Figure 1.
Schematic showing the steps in model construction, simulation, and post-processing. (A) Imaging data were segmented, and simulation meshes were created incorporating conductivity and ionic changes in areas of fibrotic tissue identified using LGE-MRI intensity values. Atrial fibrillation (AF) was simulated and analysed at a basket arrangement of points modelled based on clinical electrode locations. Pulmonary vein isolation (PVI) was applied after 5 s. (B) Models were generated for different combinations of anatomy and fibrosis distribution to build a virtual patient cohort of 100 models. (C) Simultaneous biatrial contact mapping was performed with two 64 electrode Constellation catheters.

