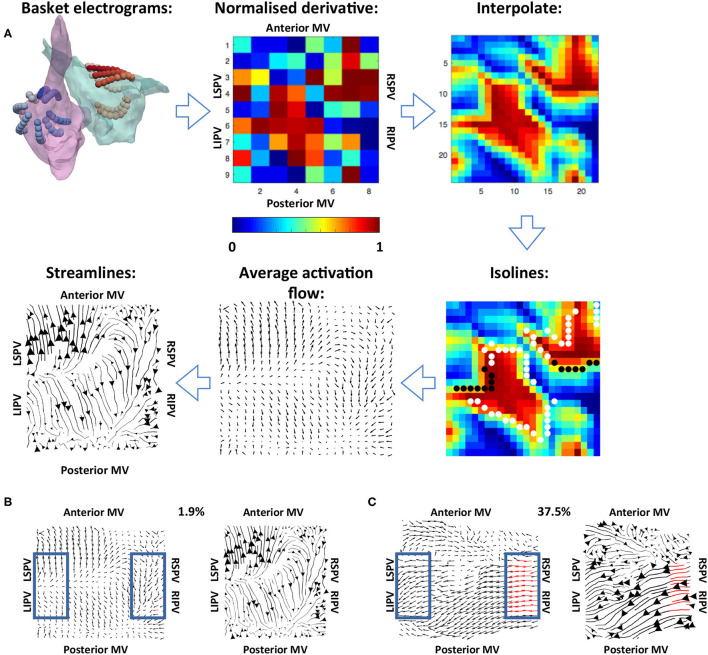
Figure 2.
Methodology used for calculating the average activation flow vector field from unipolar electrograms. (A) The normalised filtered derivative signal for each electrode on the basket catheter was displayed in a regular 9 × 8 grid. These signals were interpolated to a higher resolution grid, and optical flow vectors were calculated. The vectors were averaged over time for isolines of constant normalised filtered derivative signal (indicated by white and black dots; wavefront and wave back). Finally, streamlines were calculated from average optical flow vectors to visualise activation pathways. The normalised derivative, interpolate and isoline plots are snapshots representing the wavefronts at a given time in the recording, while the average activation flow and streamlines are calculated as an average across the 10 s recording. (B) Example PV activation flow calculation for a case with low PV activation flow. Vectors within the blue boxes were assessed, with red vectors tagged as PV antra to LA activation flow. (C) Example PV activation flow calculation for a case with high PV activation flow.

