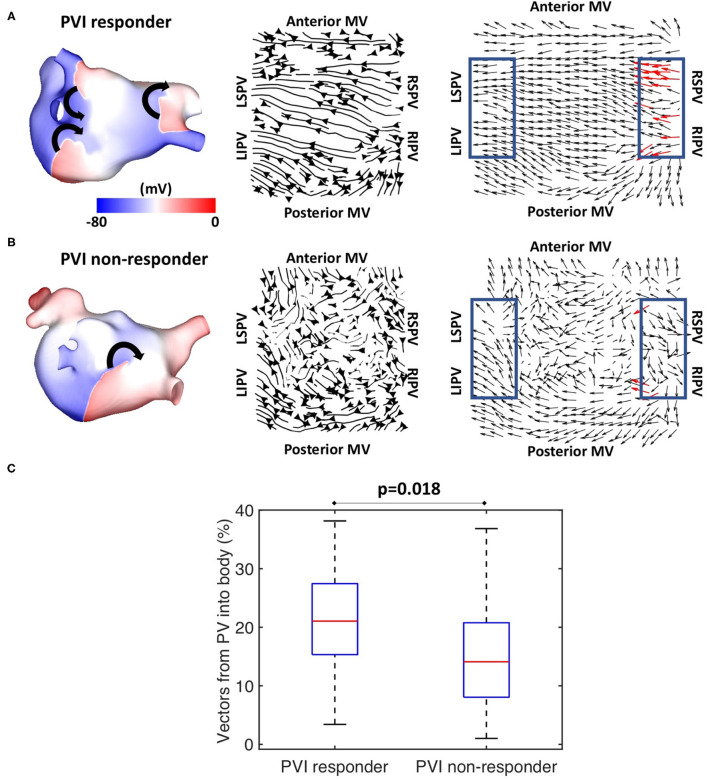
Figure 5.
Simulated data PV activation flow metric is significantly different for PVI responder and non-responder cases. Isopotential snapshots (left), streamlines (middle), and optical activation flow (right) plots for examples of (A) PVI responder and (B) PVI non-responder. PV activation flow was quantified as % of vectors pointing into the LA body in a 90° range within the PV regions (blue boxes). PV activation flow vectors are shown in red. (A) For this simulation, re-entry around the right PV drives AF pre-ablation and PVI terminates AF (an example of a responder), with a PV activation flow metric of 22.2%. (B) For this simulation, multiple drivers exist in the LA body pre-ablation, and PVI did not terminate AF (an example of a non-responder); the PV activation flow metric is 4.4%. (C) Simulated PV activation flow metric is significantly different pre-ablation for PVI responder and non-responder cases (median 21.1 vs. 14.1%, p = 0.018, Wilcoxon signed rank).

