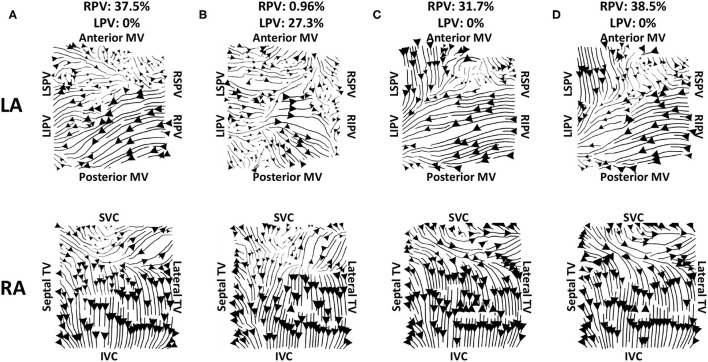
Figure 9.
Effects of recording duration on streamlines for example AF episode. Streamlines are shown for 10 s recordings taken from intervals spread through the entire recording. The top row shows the left atrium, and the bottom row shows the right atrium. The streamline plots in (A) show the original interval; panels (C,D) are visually similar to (A), while the LA for (B) demonstrates larger differences. The PV activation flow metrics from the right PV are as follows: (A) 37.5%, (B) 96%, (C) 31.7%, (D) 38.5%. There were 9 out of 10 recordings that had no activation flow from the left PV to the LA body, while (B) has a PV activation flow metric from the left PV of 27.3%. The start times for these recordings are 0, 6, 125, and 187 s.

