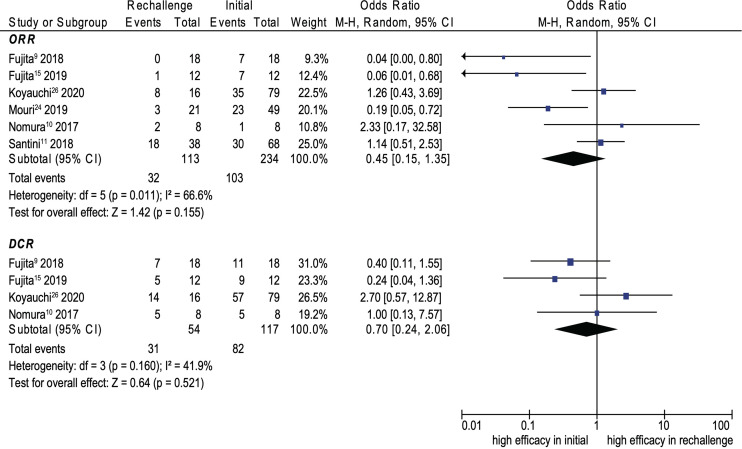
Figure 4.
Forest plot (random-effects model) of the association between ICI rechallenge and ORR or DCR after ICI rechallenge. CI, confidence interval; DCR, disease control rate; ICIs, immune checkpoint inhibitors; irAEs, immune-related adverse events; M-H, Mantel–Haenszel model; ORR, objective response rate. The sizes of the squares indicate the weight of the study.

