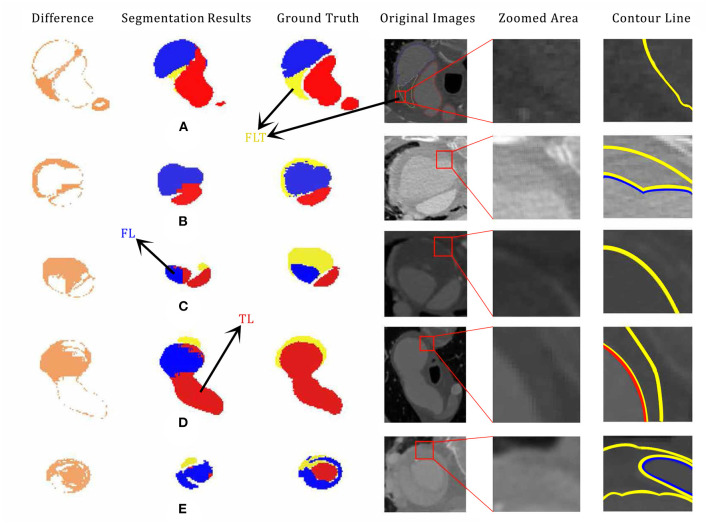
Figure 6.
Examples of poor segmentation results (A,B,C,D,E) with their corresponding ground truth, segmentation difference, original CTA image, zoomed, and labeled CTA images. The original pictures and zoomed area of each cases are accompanied. segment failed part showed the impact of the shape and margin of thrombus in segmentation process. Especially, case (D) is the same CT scan picture of Figure 3B with 180 degrees flips vertically. Best viewed in color and position.

