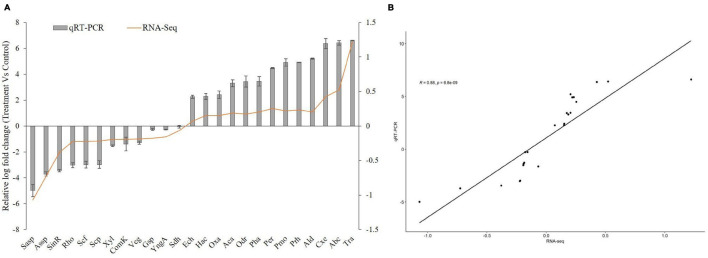
FIGURE 9.
Quantitative RT-PCR of DEGs of Bacillus species AIIW2 when grown with PET film compared with culture grown without PET film (A). Correlation analysis between qRT-PCR and RNA-Seq data expression values (B). The R and p represent the Pearson correlation coefficient and p value, respectively.

