
Figure 1.
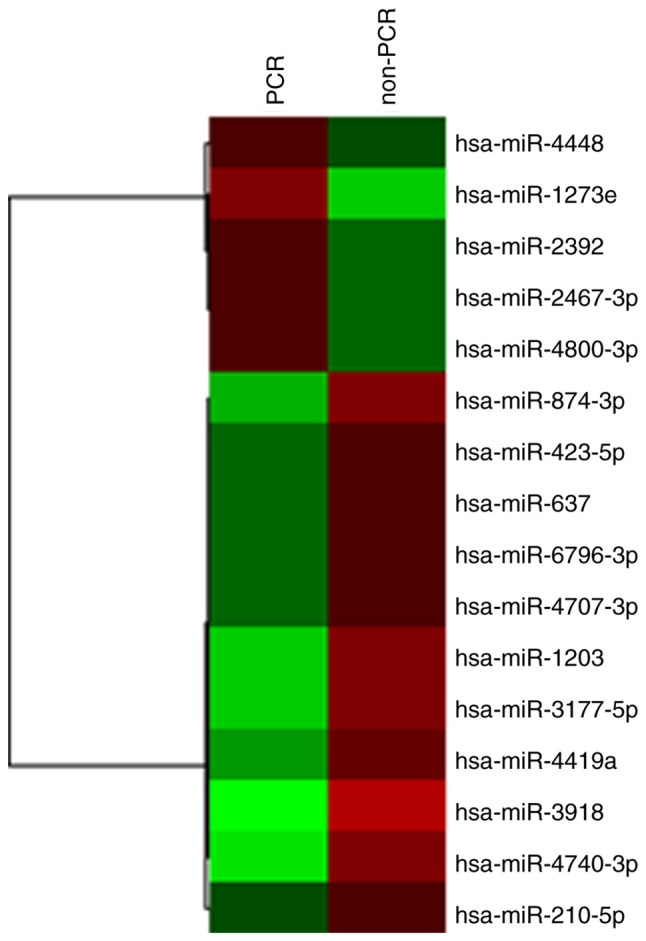
Hierarchal clustering analysis heatmap of patients with pCR compared with those with non-pCR. Red and green represent upregulated and downregulated miRNAs, respectively. The shaded areas show groups with similar expression levels. pCR, pathological complete response; miR, microRNA.