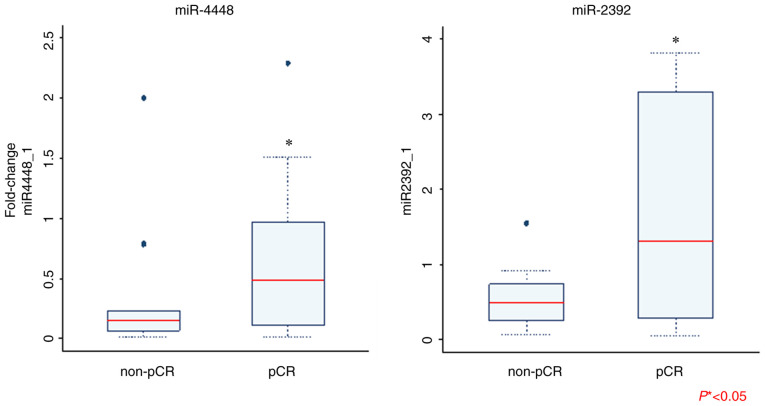
Figure 2.
Comparison of exosomal miRNA expression between patients with pCR and non-pCR as determined via reverse transcription-quantitative PCR. Only results that are statistically significant are shown. Mann-Whitney U test was performed for data analysis (*P<0.05). pCR, pathological complete response; miRNA/miR, microRNA.

