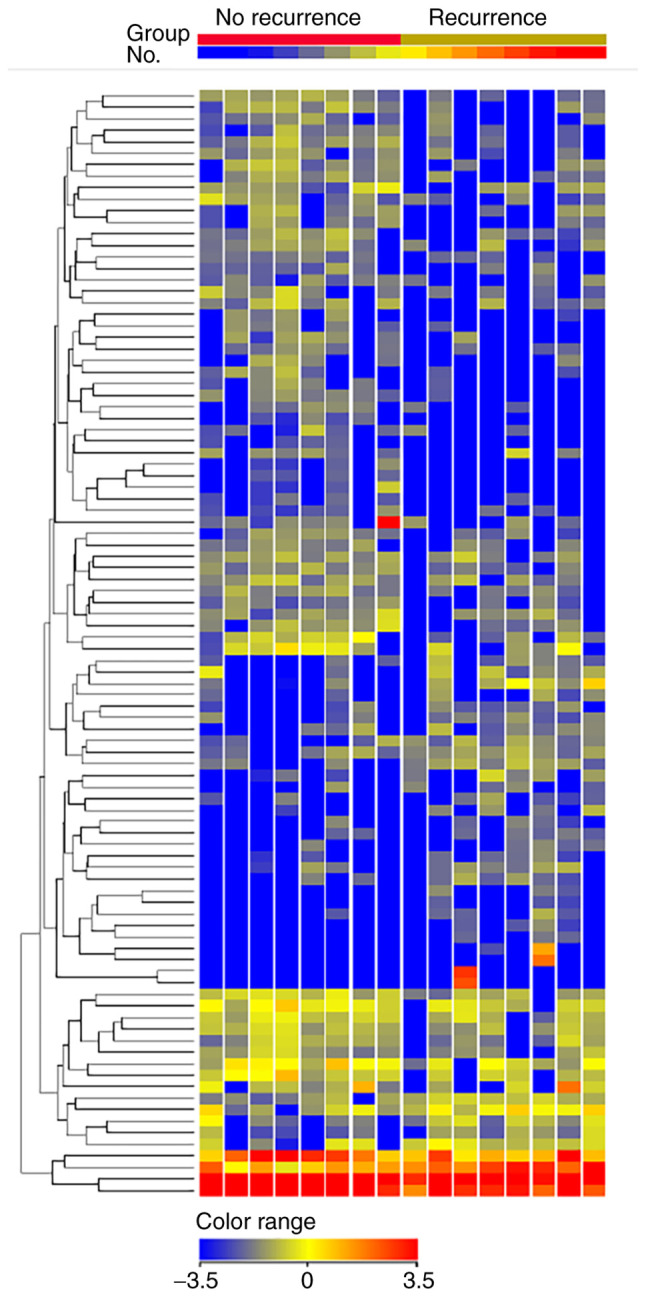
Figure 4.

Hierarchal clustering analysis observed among the non-pCR patients with recurrence (n=8) and no recurrence (n=8). Only miRNAs with fold change ≥2.0 are shown. Heatmap colors represent exosomal miRNA expression. The name of each miRNA is omitted in the figure. pCR, pathological complete response; miRNA/miR, microRNA.
