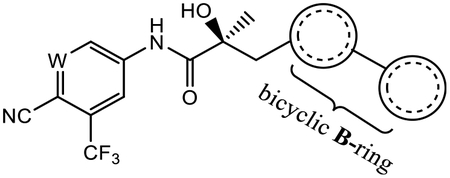
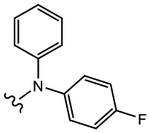
Table 2.
AR Binding and Antagonistic Activity of Propanamide Derivatives (26a–h) with Biaryl or Diaryl B-Ring Modifications

|
|||||
|---|---|---|---|---|---|
| Binding (Ki) / Transactivation (IC50) (μM) | SARD Activity (% degradation) | ||||
| Ki (DHT=lnM)a |
IC50a | Full Lengtha (LNCaP) at 1 μM |
Splice Varianta (22RV1) at 10 μM |
||
| 11 (C)b |

|
0.078 | 0.048c | 70,100d | 71–100 |
| 12 (C)c |

|
0.267 | 0.085 | 65–83 | 60–100 |
| 26a (C) |

|
0.322 | 0.178 Partial |
0, 40d | 0 |
| 26b (C) |

|
0.259 | 0.226 | 100 | 60 |
| 26c (C) |
|
0.612 | 0.969 | 60 | 0 |
| 26d (C) |

|
N.A.e | No effect | N.A. | N.A. |
| 26e (C) |

|
0.275 | 0.172 | 42 | 16 |
| 26f (C) |

|
>10 | 0.383 | 84 | 74 |
| 26g (N) |

|
1.486 | 0.217 | 12 | 0 |
| 26h (C) |

|
0.703 | 0.317 | 73 | N.A. |
|
3 (bicalutamide)c |
0.509 | 0.248 | - | - | |
|
5 (enzalutamide)c |
3.641 | 0.216 | - | - | |
AR binding, transactivation, and degradation assays were performed, and values are reported, as described in Table 1.
The compound was reported in the literature in the same assay as described here.40
The two values indicate SARD assays run with 1 and 10 μM of antagonist.
N.A. means data not available.
