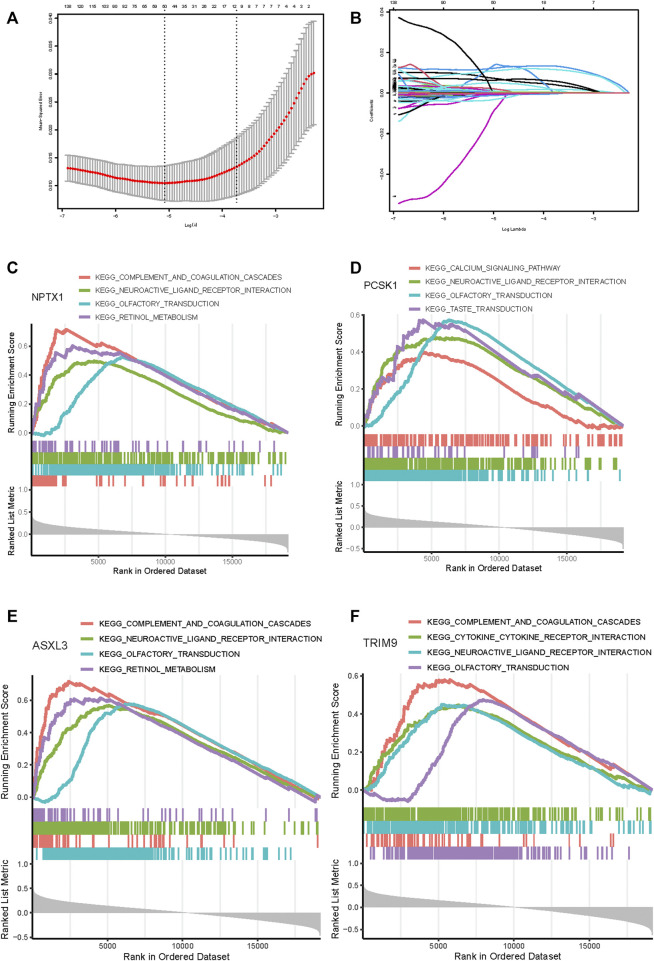
FIGURE 5.
Feature genes selection using the least absolute shrinkage and selection operator (LASSO) binary logistic regression model. (A) The result of LASSO regression analysis. (B) LASSO coefficient profiles of the 60 genes. A coefficient profile plot was produced against the log(L) sequence. Gene set enrichment analysis for NPTX1 (C), PCSK1 (D), ASXL3 (E), and TRIM9 (F). The top four pathways enriched in the high expression group are shown.

