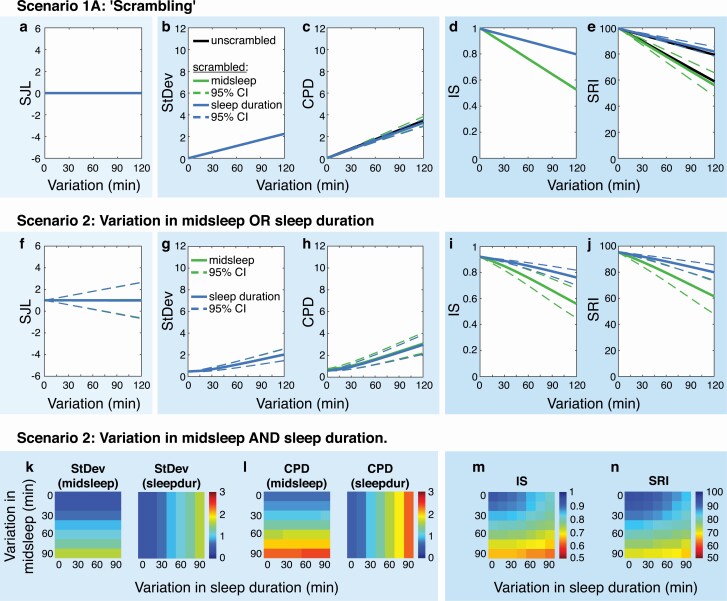
Figure 3.
Sources of variability: “scrambling,” daily variation, and weekly variation (Scenarios 1A + 2). Panels A–E show the five metrics for randomly re-ordered (“scrambled”) sleep–wake patterns in Scenario 1A. Note that the metrics SJL, StDev, and IS are identical for unscrambled and scrambled sleep patterns (i.e. zero-width 95% CIs, colored lines overlay). Panels F–J show the five metrics calculated for sleep–wake patterns of Scenario 2, with daily variation in midsleep OR sleep duration. Panels K–N show the metrics for the same patterns but with daily variations in midsleep AND sleep duration. Warmer colors in heat maps indicate “more irregular” values in all metrics. Note that SJL is not shown in the bottom row due to its non-response to daily variation (see panel A).

