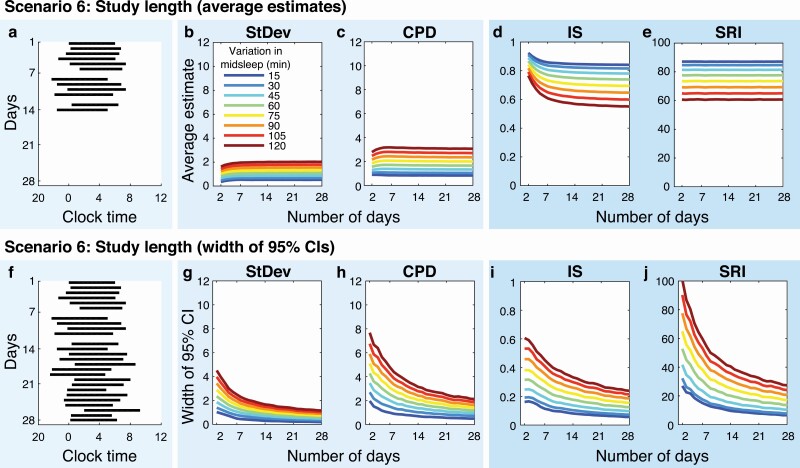
Figure 5.
Impact of study length on sleep regularity metrics (Scenario 6). The far-left panel of each row shows example raster plots of the same sleep–wake pattern, based on (A) 14 days or (F) 28 days of data. Panels (B–E) Average estimates and panels (G–J) width of 95% confidence intervals (CIs) for sleep–wake patterns based on 2–28 days of data.

